FIGURE SUMMARY
Title

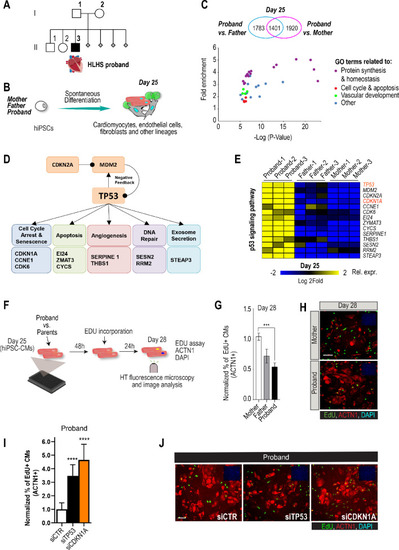
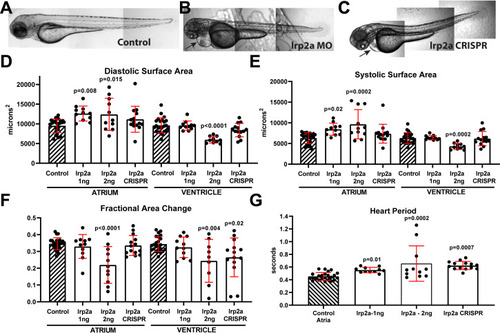
Patient-specific genomics and cross-species functional analysis implicate LRP2 in hypoplastic left heart syndrome

Authors
Theis, J.L., Vogler, G., Missinato, M.A., Li, X., Nielsen, T., Zeng, X.I., Martinez-Fernandez, A., Walls, S.M., Kervadec, A., Kezos, J.N., Birker, K., Evans, J.M., O'Byrne, M.M., Fogarty, Z.C., Terzic, A., Grossfeld, P., Ocorr, K., Nelson, T.J., Olson, T.M., Colas, A.R., Bodmer, R.
Source
Full text @ Elife

Cell cycle activity is altered in HLHS patient-derived iPSCs and CMs.

(A) Heatmap of negative regulation of cell proliferation-associated genes from RNA-seq experiments in proband vs parents. (B) Heatmap of cell cycle arrest-associated genes. (C) Heatmap of positive regulation of apoptosis-associated genes.

ZFIN is incorporating published figure images and captions as part of an ongoing project. Figures from some publications have not yet been curated, or are not available for display because of copyright restrictions.

<italic>lrp2a</italic> KD and CRISPR causes reduced contractility and bradycardia in zebrafish larva.

(A) Uninjected zebrafish larva, (B) lrp2a morpholinos (MO) (1 pl of 2 ng/µl) injected larva and (C) lrp2a CRISPR genome edited F0 larva all exhibit relatively normal body morphology at 72 hpf, note the pericardial edema evident in morphant and F0 mutant (arrows). Scale bar: 200 µm. (D) End-diastolic surface area and (E) End Systolic surface area in atria and ventricles determined from high-speed movies of beating hearts at 72 hpf. (F) Contractility, measured as fractional area change, was significantly reduced in ventricles from both morphants and mutants. (G) Heart period was significantly lengthened in morphants and mutant larvae. (D–G) Two doses of lrp2a MO were injected (1 pl of 1 ng/µl or 2 ng/µl). For CRISPR/Cas9 and guide RNA concentration, please see detailed information in the Materials and Methods section. One-way ANOVA, Dunnett’s multiple comparisons post hoc test.

Potential role for SHH, WNT and LRP2 in HLHS.

(A) A gene network integrating family-centric HLHS candidate genes with heart development. ORANGE – genes with cardiac phenotypes in iPSC/Drosophila assays. YELLOW – other candidate genes with Drosophila phenotypes. RED – Genes up-regulated in proband iPSC-CMs vs. parents. BLUE – Genes downregulated downregulated in proband iPSCs vs. parents. (B,C) qPCR for FZD10, a WNT-pathway-associated gene, (B) and for PTCH1, a SHH pathway-associated gene (C) upon LRP2 KD in hiPSC-CM. **p<0.01, *p<0.05 Student’s t-test. (D) Quantification of EdU- incorporation assay in hiPSC-CM upon LRP2 KD in combination with BIO, a WNT inhibitor. ***or ###p<0.001, ****p<0.0001, one-way ANOVA. (E) Representative images of hiPSC-CM stained for EdU and ACTN1. Scale bars: 50 µm. (F) Quantification of EdU-incorporation assay in hiPSC-CM upon LRP2 KD in combination with PTCH1 KD, a SHH-associated gene. ***p<0.001, ****p<0.0001, one-way ANOVA. (G) Representative images of hiPSC-CM stained for EdU and ACTN1. Scale bars: 50 µm.

Acknowledgments
This image is the copyrighted work of the attributed author or publisher, and ZFIN has permission only to display this image to its users. Additional permissions should be obtained from the applicable author or publisher of the image. Full text @ Elife