
- Title
-
Accelerated Amyloid Beta Pathogenesis by Bacterial Amyloid FapC
- Authors
- Javed, I., Zhang, Z., Adamcik, J., Andrikopoulos, N., Li, Y., Otzen, D.E., Lin, S., Mezzenga, R., Davis, T.P., Ding, F., Ke, P.C.
- Source
- Full text @ Adv Sci (Weinh)

In vitro cross‐seeding between FapC fragments (FapCS) and A |

DMD simulations of molecular interactions between FapC and A |

FapCS accelerated A PHENOTYPE:
|

FapCS accelerated A |

|
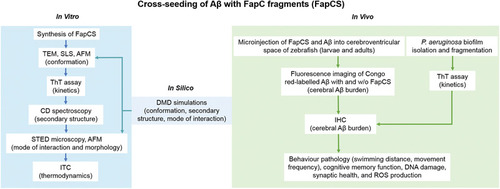
Cross‐seeding of A |