Mycobacterium fortuitum forms large corded bacterial aggregates in vitro. (A)M. abscessus CIP104536T smooth (S) and rough (R) variants, M. fortuitum subsp. fortuitum (ATCC 6841) and M. smegmatis mc2155 were inoculated in 7H9OADC/T at an optical density of 0.05 (OD620) and incubated at 30°C and (B) 37°C under shaking at 100 rpm. Growth measurements were taken daily over a 7-day period until cultures reached stationary phase. Data shown is the merge of two independent experiments. Error bars represent standard deviation. (C)In vitro liquid growth properties of the different NTM species in CaMHB medium following 3–4 days static culture at 30°C in a 96-well plate. The boxed area depicts the zoomed section of liquid growth in the bottom left hand corner of each well. Scale bars represent 2 mm. (D)In vitro solid agar growth properties of M. fortuitum and M. abscessus R variant following 3 days growth at 30°C. Scale bars represent 1 mm.

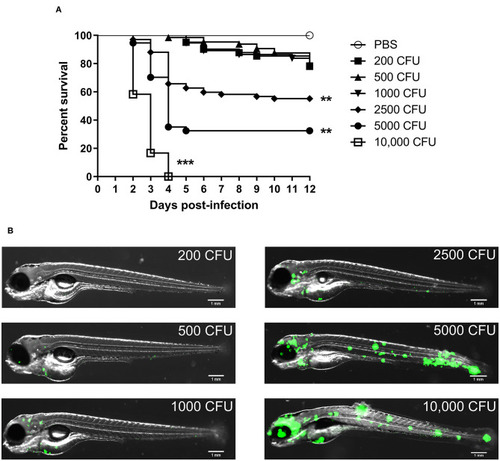
Zebrafish embryos are susceptible to Mycobacterium fortuitum infection in a dose-dependent manner. (A) Zebrafish embryos were injected with varying dosages of GFP-expressing M. fortuitum at 30 h post-fertilization via caudal vein injection. Embryo survival was monitored over a 12 day period. N = 20–25 embryos/group. Statistical analysis was completed using the log-rank (Mantel-Cox) statistical test for survival curves. Data shown is the merge of two independent experiments. (B) Representative images of zebrafish embryos infected with varying dosages of GFP-expressing M. fortuitum at 2 days post-infection. Green represents M. fortuitum. Scale bars represent 1 mm. **P ≤ 0.01, ***P ≤ 0.001.

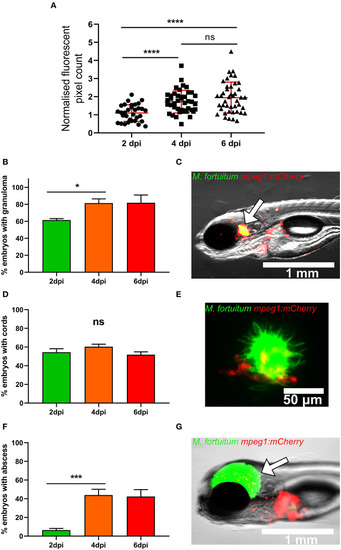
Zebrafish infected with Mycobacterium fortuitum recapitulate the hallmark features of other pathogenic mycobacteria. (A) Following infection mpeg1::mCherry zebrafish embryo at 30 h post-fertilization via caudal vein injection with 300 CFU of GFP-expressing M. fortuitum, bacterial burden was quantified using fluorescent pixel count (FPC determination using ImageJ software) at 2, 4, and 6 days post-infection. For each experiment, all groups were normalized against the 2 days post-infection group. Each datapoint represents an individual embryo. Error bars represent standard deviation. Statistical significance was determined by Student′s t-test. Plots represent a pool of 2 independent experiments containing approximately 20 embryos per group. (B) The granuloma formation kinetic in embryos following infection with M. fortuitum. Error bars represent standard deviation. Data shown is the merge of two independent experiments. Statistical significance was determined by Student′s t-test. (C) Representative image of a granuloma at 4 days post-infection. The white arrow highlights the granuloma. Scale bar represents 1 mm. (D) The kinetic of bacterial cord formation in zebrafish embryos following M. fortuitum infection. Error bars represent standard deviation. Data shown is the merge of two independent experiments. Statistical significance was determined by Student′s t-test. (E) Representative image of a bacterial corded M. fortuitum aggregate surrounded by recruited macrophages at 4 days post-infection. Note the sheer size of the bacterial aggregate in comparison to the smaller macrophages. Green represents M. fortuitum, while red represents macrophages. Scale bar represents 50 μm. (F) The kinetic of abscess formation in zebrafish embryos infected with M. fortuitum. Error bars represent standard deviation. Data shown is the merge of two independent experiments. Statistical significance was determined by Student′s t-test. (G) Representative image of an M. fortuitum abscess at 4 days post-infection. The white arrow highlights the abscess. Green represents M. fortuitum, while red represents macrophages. Scale bar represents 1 mm. *P ≤ 0.05, ***P ≤ 0.001, ****P ≤ 0.0001.

Lipoclodronate macrophage depletion results in lethal M. fortuitum infection. (A) At 24 h post-fertilization, embryos were treated with liposomal clodronate via caudal vein injection to transiently deplete macrophages. At 30 h post-fertilization, embryos were injected intravenously with 300 CFU of GFP-expressing M. fortuitum with embryo survival monitored over a 12 day period. n = 20–25 embryos/group. Statistical analysis was completed using the log-rank (Mantel-Cox) statistical test for survival curves. Data shown is the merge of two independent experiments. (B) Bacterial burden at 2 days post-infection was calculated using fluorescent pixel count (FPC) determination with ImageJ software. Lipoclodronate-treated embryos were normalized against corresponding controls in each experiment. Each datapoint represents an individual embryo. Error bars represent standard deviation. Statistical significance was determined by Student′s t-test. Plots represent a pool of 2 independent experiments containing approximately 20 embryos per group. (C) Representative images of wild-type (WT) and Lipoclodronate-treated embryos infected with 300 CFU of GFP-expressing M. fortuitum at 2 days post-infection. Scale bars represent 1 mm. (D) The proportion of embryos with bacterial cords and the total distribution of cords categorized as low (<5 cords/embryo), moderate (6–10 cords/embryo) and high (>10 cords/embryo) in M. fortuitum-infected embryo at 2 days post-infection. Error bars represent standard deviation. Data shown is the merge of two independent experiments. Statistical significance was determined by Student′s t-test. (E) The proportion of embryos with abscesses and the average number of abscesses per infected embryo at 2 days post-infection. Error bars represent standard deviation. Data shown is the merge of two independent experiments. Statistical significance was determined by Student′s t-test. **P ≤ 0.01, ****P ≤ 0.0001.

CFTR ablation leads to rapid larval death and uncontrolled bacterial expansion. (A)Cftr mrophants at 30 h post-fertilization were infected with 300 CFU of GFP-expressing M. fortuitum via caudal vein injection and embryo survival was monitored over a 12 day period. N = 20–25 embryos/group. Statistical analysis was completed using the log-rank (Mantel-Cox) statistical test for survival curves. Data shown is the merge of three independent experiments. (B) Bacterial burden was quantified by fluorescent pixel count (FPC) determination using ImageJ software, with each data point representing an individual embryo. Each group was normalized against the wild-type cohort at 2 days post-infection. Error bars represent standard deviation. Statistical significance was determined by Student′s t-test. Plots represent a pool of three independent experiments containing ~20–25 embryos per group. (C) Representative images of wild-type (WT) and CFTR depleted (cftr) embryos infected with 300 CFU of GFP-expressing M. fortuitum at 2 days post-infection. Scale bars represent 1 mm. (D) The proportion of embryos with bacterial cords and the average number of cords per infected embryo at 2 and 4-days post-infection. Error bars represent standard deviation. Data shown is the merge of three independent experiments. Statistical significance was determined by Student′s t-test. (E) The proportion of embryos with abscesses and the average number of abscesses per infected embryo at 2 and 4-days post-infection. Error bars represent standard deviation. Data shown is the merge of three independent experiments. Statistical significance was determined by Student′s t-test. (F) The proportion of embryos with granulomas and the average number of granulomas per infected embryo at 2 and 4-days post-infection. Error bars represent standard deviation. Data shown is the merge of three independent experiments. Statistical significance was determined by Student′s t-test. *P ≤ 0.05, **P ≤ 0.01, ****P ≤ 0.0001.

A hypothetical schematic summarizing the pathogenesis of Mycobacterium fortuitum in both wild-type and CFTR backgrounds. (1) Following intravenous injection of M. fortuitum into zebrafish embryos, macrophages are rapidly recruited to the site of infection and phagocytose bacilli; (2) Once inside the phagosome, M. fortuitum is able to initially replicate, however in a wild-type scenario, host defenses are able to slow the bacterial expansion until further macrophages are recruited. Comparatively, following CFTR depletion, bacteria are able to rapidly expand within the phagosome, presumably due to defective host oxidative defense mechanisms. (3) Additional macrophages are recruited to the infection foci, forming the granuloma which acts to contain infection dissemination in wild-type embryos. In a proportion of wild-type embryos, we propose that macrophage apoptosis triggers the escape of bacilli to the extracellular space which facilitates the growth of bacilli into large corded aggregates, promoting zebrafish embryo death. In CFTR-depleted embryos, there are fewer granulomas and a greater proportion of cords which leads to more rapid embryonic death and a greater proportion of cords and abscesses.

Acknowledgments
This image is the copyrighted work of the attributed author or publisher, and ZFIN has permission only to display this image to its users. Additional permissions should be obtained from the applicable author or publisher of the image. Full text @ Front Cell Infect Microbiol