FIGURE SUMMARY
Title

Protective Activities of Dendrobium huoshanense C. Z. Tang et S. J. Cheng Polysaccharide against High-Cholesterol Diet-Induced Atherosclerosis in Zebrafish

Authors
Fan, X., Han, J., Zhu, L., Chen, Z., Li, J., Gu, Y., Wang, F., Wang, T., Yue, Y., Shang, J.
Source
Full text @ Oxid Med Cell Longev

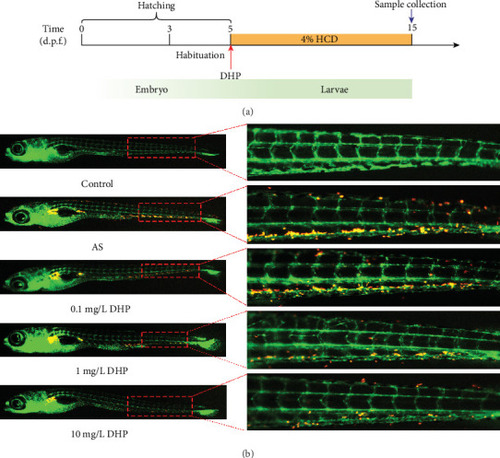
DHP reduced the formation of plaques in AS zebrafish. (a) Schematic representation of the experimental procedure. (b) Hypercholesterolemic zebrafish larvae induced by 4% red fluorescence-labeled HCD for 10 days. Red dotted square denoted the main location of lipid accumulation.

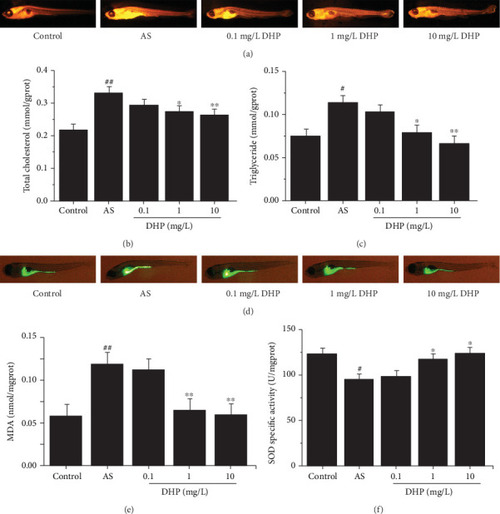
DHP improved lipid metabolism homeostasis and oxidative stress in AS zebrafish. (a) Representative images of Nile Red staining of AS zebrafish larvae treated with 0.1, 1, and 10 mg/L DHP for 10 days. (b) TC and (c) TG contents in whole mount of zebrafish larvae (n = 40). (d) Detected the production of ROS by DCFH-DA and captured using stereomicroscope (green fluorescence). Oxidized species content of (e) MDA and (f) SOD was quantified in the whole body of zebrafish larvae (n = 40). SD was depicted as vertical bars. #p < 0.05, ##p < 0.01, compared with control group; p < 0.05, ∗∗p < 0.01, compared with AS group. Significance was calculated by one-way ANOVA followed by unpaired t-test. n represents the numbers of zebrafish larvae.

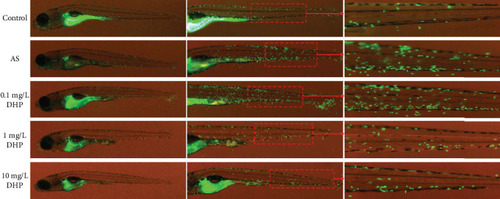
DHP protected against inflammation in AS zebrafish. Anti-inflammatory effect of DHP in 4% HCD induced inflammation model of the Tg (mpx: EGFP) zebrafish larvae. Squares mark the specific regions of near the tail of zebrafish larvae (red). The green fluorescence indicates the levels of inflammation emitted by the neutrophils.

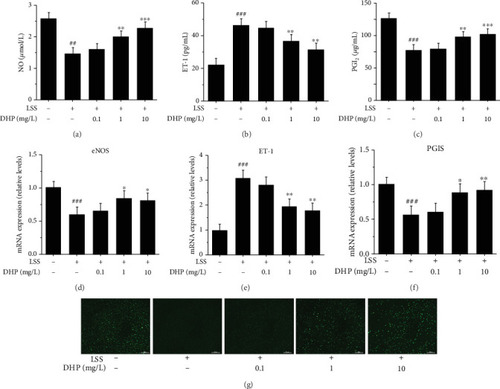
DHP improved LSS-induced EC dysfunction. (a) NO, (b) ET-1, and (c) PGI2 levels after EA.hy 926 cells were exposed to LSS by a parallel flow chamber with DHP (0.1, 1, and 10 mg/L) treatment or not. The mRNA expression of (d) eNOS, (e) ET-1, and (f) PGIS by RT-qPCR (n = 3). (g) The fluorescence intensity of NO after EA.hy 926 cells were exposed to LSS by a parallel flow chamber. SD was depicted as vertical bars. ##p < 0.05, ###p < 0.001, compared with the control group (LSS, 0 min); p < 0.05, ∗∗p < 0.01, ∗∗∗p < 0.001, compared with the LSS group (LSS, 30 min). Significance was calculated by one-way ANOVA followed by unpaired t-test. n represents the independent experiments.

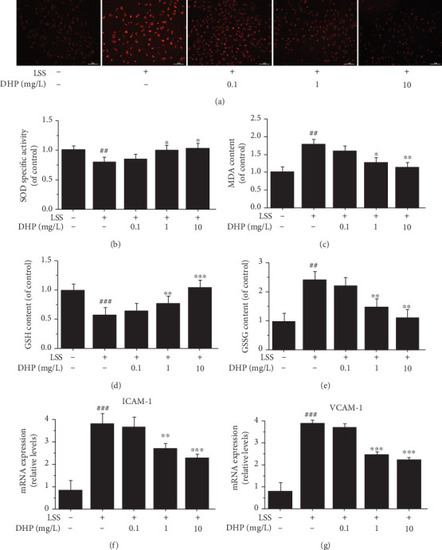
DHP improved LSS-induced oxidative stress and inflammation. (a) ROS levels after EA.hy 926 cells were exposed to LSS by a parallel flow chamber with DHP (0.1, 1, and 10 mg/L) treatment or not. Oxidized species content of (b) SOD, (c) MDA, (d) GSH, and (e) GSSG was quantified in EA.hy 926 cells induced by LSS. The mRNA expression of (f) ICAM-1 and (g) VCAM-1 by RT-qPCR (n = 3). SD was depicted as vertical bars. ##p < 0.01, ###p < 0.001, compared with the control group (LSS, 0 min); p < 0.05, ∗∗p < 0.01, ∗∗∗p < 0.001, compared with the LSS group (LSS, 30 min). Significance was calculated by one-way ANOVA followed by unpaired t-test. n represents the independent experiments.

Acknowledgments
This image is the copyrighted work of the attributed author or publisher, and ZFIN has permission only to display this image to its users. Additional permissions should be obtained from the applicable author or publisher of the image. Full text @ Oxid Med Cell Longev