Overview of SpaOTsc.

a The unbalanced transport relaxes the mass conservation constraint (e.g. lines between circles), and the structured transport utilizes additional information (e.g. dotted links) to refine the mapping (e.g. blue hexagon). b Cell–cell distance is inferred by computing optimal transport distance of the spatial probability distributions of cells (rows of γ in a). c Calculated cell–cell distance, along with partial information decomposition and random forest models, is used to infer spatial distance of signaling and then construct space-constrained cell–cell communications and identify potential intercellular regulation between genes.

Validation of SpaOTsc using three systems.

a Predicted spatial expressions for the zebrafish embryo (both data from ref. 13). b The receiver operating characteristics (ROC) curves of leave-one-out cross-validation (LOO CV) of the spatial expression prediction for the zebrafish embryo data. c Predicted spatial expressions for the Drosophila embryo (both data from ref. 10). d The ROC curves of LOO CV of the spatial expression prediction for the Drosophila embryo spatial data. e Assignment of spatial positions to the scRNA-seq data for the mouse visual cortex (spatial data from ref. 38; scRNA-seq data from ref. 37). Each column depicts all cells from the spatial data in the visual cortex. For example, in column one, the color of cells represents the average probability of the spatial origin of the 890 cells in scRNA-seq data labeled with spatial origin L1. f Violin plots along L1-L6 axis of the mapped spatial origins for single cells from each subregion. Inside the violin plots are standard boxplots (median, 25th perceltile, 75th percentile, the bigger of minimum value and 25th percentile – 1.5 interquartile range, and smaller of maximum value and 75th percentile + 1.5 interquartile range). The numbers of data points for the violin plots from left to right are 890, 1979, 1594, 3040, 2899, respectively.

Metric spaces and spatial gene atlases for scRNA-seq data.

a A low-dimensional spatial visualization (UMAP) of mouse visual cortex scRNA-seq data (ref. 37) using the cell–cell distance inferred by SpaOTsc with the spatial data (ref. 38). The cell labels are taken from ref. 37. b Similar to (a) but for Drosophila embryo data (ref. 10). c, d The gene spatial atlases for mouse visual cortex data (c) and Drosophila embryo data (d) consisted of collections of highly variable genes where nodes represent genes and edges indicate similarity in spatial pattern.

Reconstruction of cell–cell communications in space.

a (zebrafish embryo) Wnt and BMP signalings interpolated from the SpaOTsc cell–cell communication matrix and mapped to space using the mapping between cells and positions. The arrow lengths indicate the signal sending probability of the position and the color shows the estimated signal receiver probability distribution over space. The scRNA-seq data from ref. 36 and spatial data from ref. 13 were used. b (zebrafish embryo) Wnt and BMP signaling summarized into cell clusters. c, d (Drosophila embryo) Spatial ranges of Wg and Dpp signaling inferred using a series of sets of random forest models. The gray band represents the 95% confidence interval. The experiment was repeated three time with similar results. e (Drosophila embryo) Left: cell–cell communications of Wg signaling at the single-cell level using a visualization (UMAP) constrained by cell–cell distance. The color of the link is marked by the color of the sending cells, based on the clustering using only scRNA-seq data. Right: cluster–cluster communications of Wg signaling based on SpaOTsc spatial subclustering (subcluster the previously determined clusters based only on scRNA-seq data using the cell–cell distance). f (Drosophila embryo) Dpp signaling in space plotted similar to (e).

Intercellular gene–gene regulatory information flows.

a (Drosophila embryo) The intercellular gene–gene regulatory information flow for the top 20 variable genes in Drosophila embryo scRNA-seq data. For example, gene Twist in the 25 μm shell is connected with gene Snail (red curve), suggesting Snail is directly or indirectly affected by Twist in neighbor cells within a spatial distance of 25 μm. b (zebrafish embryo) The intercellular gene–gene regulatory information flow for the variable genes involved in Wnt signaling or BMP signaling. Relative distances are considered where short, medium and long range corresponds to 1/8, 1/4 and 1/2 of the embryo radius. c Heatmaps of the information flows at different spatial scales showing the intercellular regulation within and across the two signaling modules.

Application of SpaOTsc to spatial transcriptomic data and their integrations with scRNA-seq datasets.

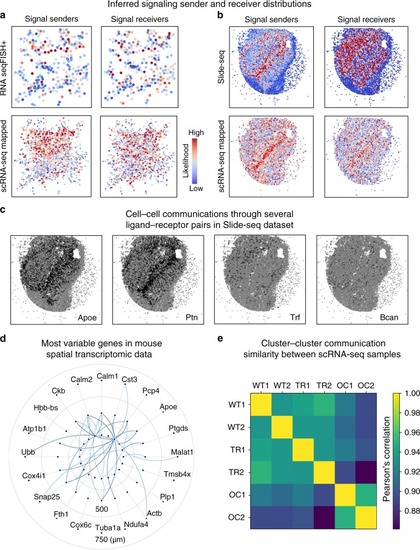
The Slide-seq data, the RNA seqFISH+ data, and the scRNA-seq data for mouse olfactory bulb were taken from ref. 51, ref. 52, and ref. 53, respectively. a, b Spatial distributions of signal senders and receivers with the color showing the likelihood of being a sender or receiver. Top row: inference using only spatial transcriptomics data. Bottom row: the inferred signaling in scRNA-seq data (sample WT1) visualized by mapping the single cells to space using spatial transcriptomic data. c Signaling for four individual marked ligands in the Slide-seq data. d The intercellular gene–gene regulatory information flow of the top 20 variable genes in the Slide-seq data. e Similarities on cluster–cluster communication between the six samples of the scRNA-seq data integrated with the RNA seqFISH+ data measured by Pearson’s correlation coefficient.

Acknowledgments
This image is the copyrighted work of the attributed author or publisher, and ZFIN has permission only to display this image to its users. Additional permissions should be obtained from the applicable author or publisher of the image. Full text @ Nat. Commun.