Methiothepin inhibits the viability and proliferation of ES2 and OV90 cells. (A) The viability of ES2 and OV90 cells, in accordance with the dose and duration of treatment with methiothepin, was analyzed by trypan blue exclusion assay. (B) Changes in proliferation of ES2 and OV90 cells following methiothepin treatment were analyzed by trypan blue exclusion assay. (C) The effect of methiothepin on intracellular ATP levels in ES2 and OV90 cells was assessed via colorimetric analysis. (D) Morphological changes of ES2 and OV90 cells following methiothepin treatment were analyzed by Diff-Quik staining. (E) The 3D structure for spheroid formation of ES2 and OV90 cells following methiothepin treatment was quantified using the ReViSP software. Results are expressed as the mean ± SDs of three independent experiments. The asterisks indicate statistically significant differences compared to the control (* p < 0.05; ** p < 0.01; *** p < 0.001). Scale bar indicates 100 μm.

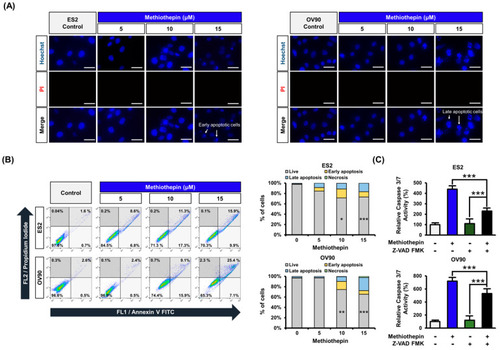
Regulation of cell death by methiothepin in ES2 and OV90 cells. (A) Hoechst (blue) and PI (red) staining was performed for cell death analysis in ES2 and OV90 cells. Scale bar indicates 40 μm. (B) Annexin V and PI staining were used to measure the death of ES2 and OV90 cells following methiothepin treatment. The percentage of cell distribution observed by flow cytometry was determined for the apoptotic pattern in each quadrant. The lower left quadrant corresponds to live cells, the upper left, to necrosis, the lower right, to early apoptosis, and the upper right, to late apoptosis. (C) The activity of caspase 3/7 in ES2 and OV90 cells treated with methiothepin was measured following the treatment of the cells with the pan-caspase inhibitor Z-VAD FMK. Results are expressed as the means ± SDs of three independent experiments. The asterisks indicate statistically significant differences compared to the control (* p < 0.05; ** p < 0.01; *** p < 0.001).

Effects of methiothepin on the expression of intrinsic apoptosis regulators in ES2 and OV90 cells. (A) Expression of apoptosis-related proteins following methiothepin treatment in ES2 and OV90 cells was analyzed by western blotting. (BE) In order to quantify the expression of (B) MCL-1, (C) BCL-2, (D) BCL-xL, and (E) cleaved PARP in ES2 and OV90 cells following treatment with methiothepin, the intensity of the bands corresponding to each protein was normalized to the β-actin band intensity. The asterisks indicate statistically significant differences compared to the control (** p < 0.01; *** p < 0.001).

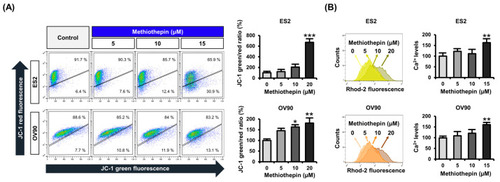
Effect of methiothepin on mitochondrial membrane potential (ΔΨ) and mitochondrial Ca2+ levels in ES2 and OV90 cells. (A) The change in ΔΨ by methiothepin in ES2 and OV90 cells was analyzed by JC-1 staining. The degree of depolarization of the mitochondrial membrane was determined based on JC-1 green/red ratio. (B) The change of mitochondrial Ca2+ levels in ES2 and OV90 cells following methiothepin treatment was analyzed by staining with the Rhod-2 dye. Results are expressed as the means ± SDs of three independent experiments. The asterisks indicate statistically significant differences compared to the control (* p < 0.05; ** p < 0.01; *** p < 0.001).

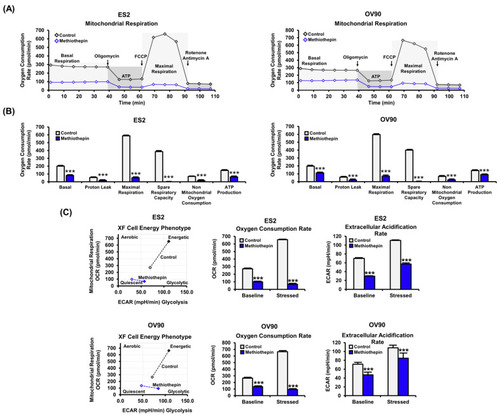
Metabolic profiling following methiothepin treatment in ES2 and OV90 cells. (A) The metabolic profiling changes in ES2 and OV90 cells following methiothepin treatment were analyzed by seahorse analysis with oligomycin, FCCP, Antimycin A, and Rotenone treatment. (B) Basal OCR, proton leak, maximal respiration, and ATP production were analyzed as the metabolic parameters in ES2 and OV90 cells in response to treatment with methiothepin. (C) The energy phenotypes in ES2 and OV90 cells were obtained by seahorse assay following treatment with methiothepin. In ES2 and OV90 cells, oxygen consumption rate and extracellular acidification rate under baseline (open marker) and stressed (closed marker) conditions following methiothepin treatment were analyzed. Results are expressed as the means ± SDs of three independent experiments. The asterisks indicate statistically significant differences compared to the control (*** p < 0.001).

Effects of methiothepin on the expression of ER stress-related proteins in ES2 and OV90 cells. (A) Expression of ER stress-related proteins following methiothepin treatment in ES2 and OV90 cells was analyzed through western blotting. (BE) In order to quantify the expression of (B) GRP78/Bip, (C) p-PERK, (D) ATF4, and (E) CHOP in ES2 and OV90 cells following treatment with methiothepin, the intensity of the band corresponding to each protein was normalized to the β-actin band intensity. The asterisks indicate statistically significant differences compared to the control (* p < 0.05; ** p < 0.01; *** p < 0.001).

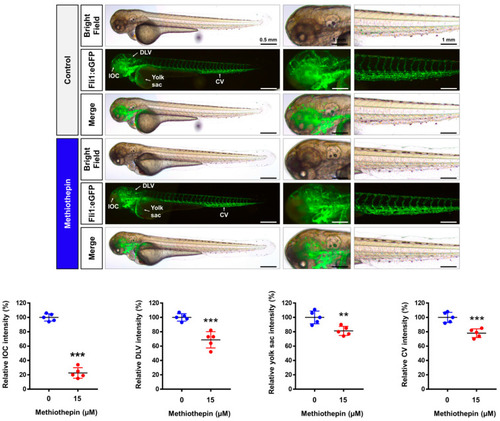
Impairment of vasculogenesis by methiothepin exposure in zebrafish embryos. Fluorescence images of transgenic (fli1:eGFP) zebrafish embryos after treatment with methiothepin for 48 h were captured by fluorescent microscopy. Quantification of fluorescence intensity in the vascular structures of the inner optic circle (IOC), dorsal longitudinal vein (DLV), yolk sac, and caudal vein (CV) of zebrafish embryos following methiothepin exposure was performed using ImageJ software. The asterisks indicate statistically significant differences compared to the control (** p < 0.01; *** p < 0.001). Scale bar represents 0.5 mm (the first vertical panels) and 1 mm (the second and third vertical panels).

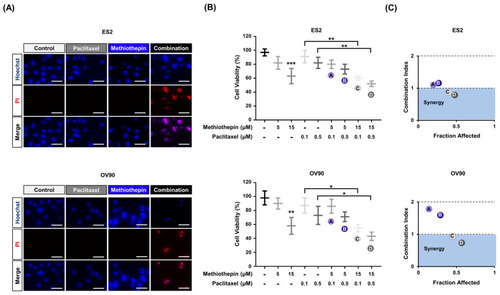
Synergistic effects of methiothepin treatment on paclitaxel sensitivity in ES2 and OV90 cells. (A) Hoechst (blue) and PI (red) staining analysis of ES2 and OV90 cells after combination treatment with methiothepin and paclitaxel. Scale bar indicates 40 μm. (B) Analysis of the viabilities of ES2 and OV90 cells revealed that methiothepin and paclitaxel are synergistic in inhibiting the viability of these cells. (C) The synergistic effects of the combination of methiothepin and paclitaxel on the viability of ES2 and OV90 cells were calculated based on the combination index (CI) and fraction affected (FA) using the CompuSyn software. Results are expressed as the means ± SDs of three independent experiments. The asterisks indicate statistically significant differences compared to the control (* p < 0.05; ** p < 0.01; *** p < 0.001).

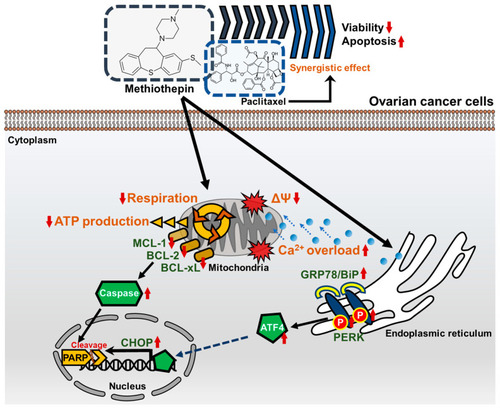
Schematic diagram of the methiothepin-associated anti-cancer mechanisms in ovarian cancer cells. In ovarian cancer cells, methiothepin induces depolarization in the mitochondrial membrane (also known as mitochondria membrane potential, ΔΨ) and promotes the influx of Ca2+. Metabolic disorders caused by methiothepin are indicated by a decrease in mitochondrial respiration and adenosine triphosphate (ATP) production. The expression of proteins belonging to the BCL-2 family are inhibited by methiothepin, which leads to the cleavage of poly (ADP-ribose) polymerase (PARP), along with the activation of caspases. Meanwhile, methiothepin increases the expression of ER stress-related proteins and finally induces the expression of C/EBP homologous protein (CHOP), which leads to apoptosis. Methiothepin improves the anti-cancer effect of paclitaxel, greatly reducing the viability of ovarian cancer cells.

Acknowledgments
This image is the copyrighted work of the attributed author or publisher, and ZFIN has permission only to display this image to its users. Additional permissions should be obtained from the applicable author or publisher of the image. Full text @ Pharmaceutics