
- Title
-
Antibiotic-Driven Gut Microbiome Disorder Alters the Effects of Sinomenine on Morphine-Dependent Zebrafish
- Authors
- Chen, Z., Zhijie, C., Yuting, Z., Shilin, X., Qichun, Z., Jinying, O., Chaohua, L., Jing, L., Zhixian, M.
- Source
- Full text @ Front Microbiol
|

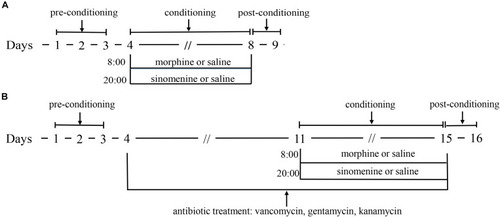
Time spent by zebrafish in the drug-pair compartment. ( |

Effect of sinomenine use on the gut microbiome accompanying morphine dependence. |
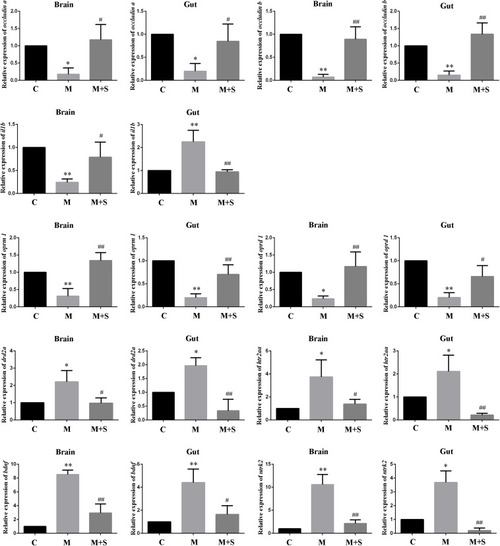
qPCR analysis of |
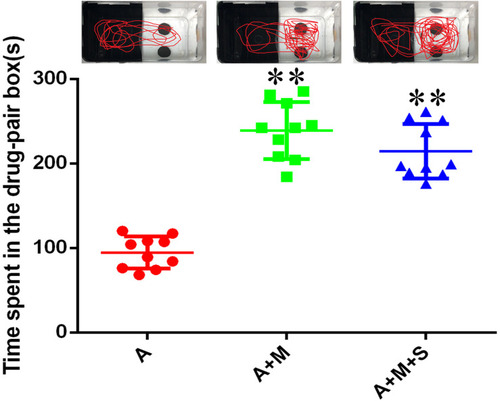
Time spent by zebrafish in the drug-pair compartment. ( |
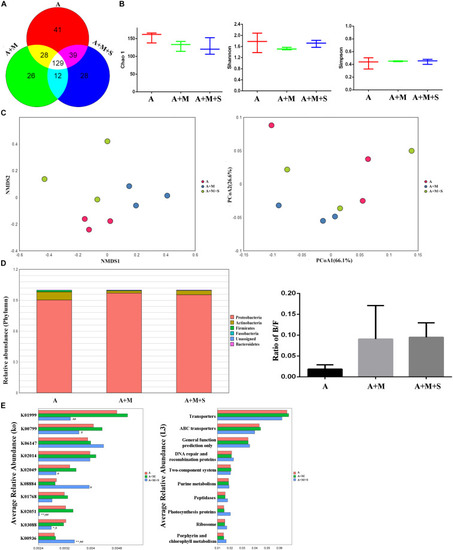
Effect of antibiotic use on the sinomenine treatment of the morphine-dependent gut microbiome. |
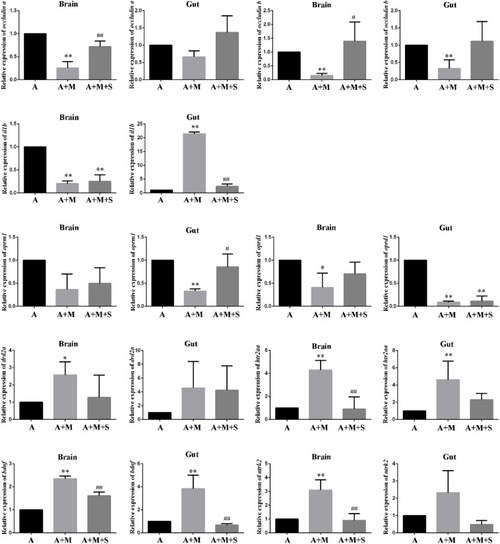
qPCR analysis of |