
- Title
-
Spatiotemporal Characterization of Anterior Segment Mesenchyme Heterogeneity During Zebrafish Ocular Anterior Segment Development
- Authors
- Van Der Meulen, K.L., Vöcking, O., Weaver, M.L., Meshram, N.N., Famulski, J.K.
- Source
- Full text @ Front Cell Dev Biol
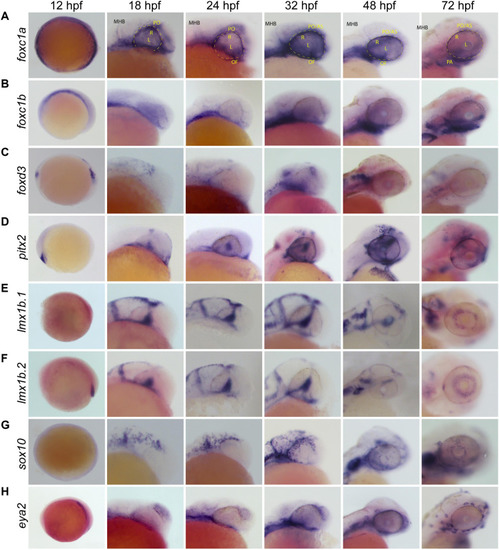
Whole Mount |
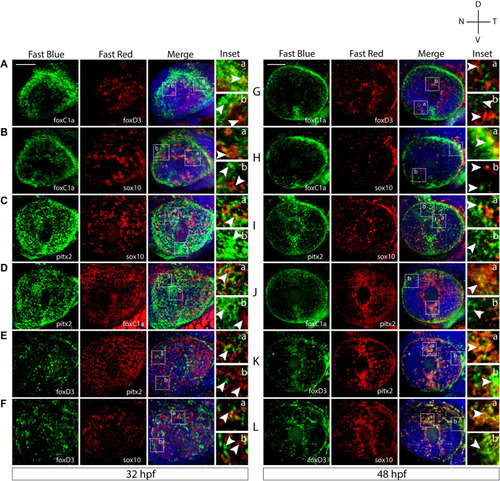
Two-color fluorescent |
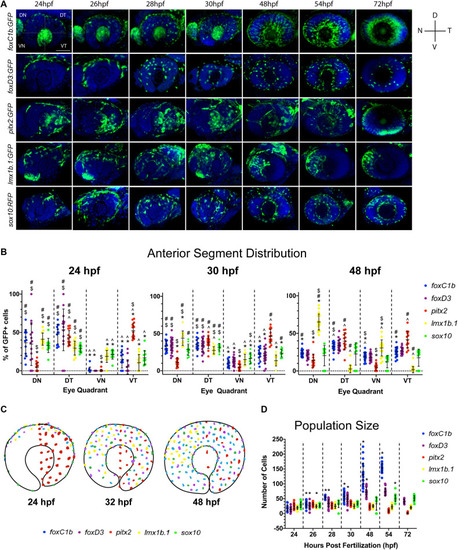
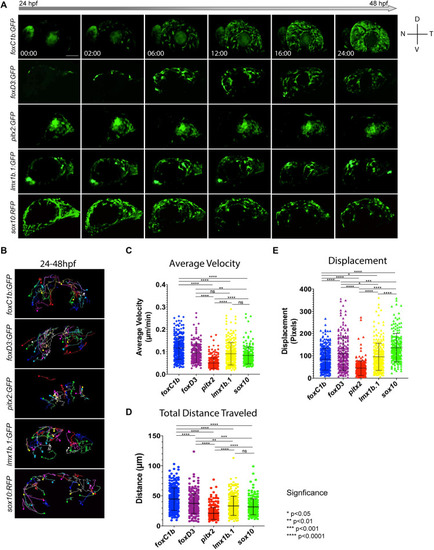
Periocular mesenchyme subpopulation distribution analysis. |
|

Anterior segment mesenchyme single cell clustering analysis at 48 hpf. |

Gene expression of sequencing-derived genes. Whole-mount |