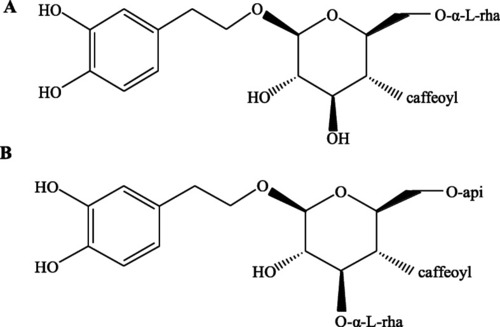
Chemical structures of forsythiaside A (a) and forsythiaside B (b)

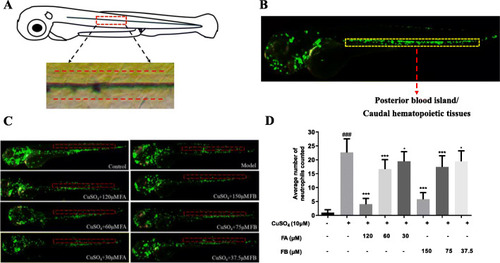
FA and FB inhibited the migration of neutrophils to the injury site in CuSO4-treated zebrafish. a A general view of the zebrafish larvae at 3 dpf. The boxed area represented the horizontal lateral line, and neutrophils within the horizontal line (dotted red lines) were calculated in quantification experiments. b The area of the posterior blood island or caudal hematopoietic tissues (the boxed region with dotted yellow lines) in an untreated transgenic (mpx: EGFP) zebrafish. Most leukocytes in this development stage were distributed in this area. c Microphotographs exhibited neutrophils migration in the control, model, FA, and FB groups (neutrophils of 3 dpf transgenic (mpx: EGFP) zebrafish exhibiting green fluorescence). The red dotted lines represented the location of the horizontal muscles of zebrafish. d FA and FB dose-dependently reduced the number of neutrophils recruited in the injury site. #p < 0.05, ##p < 0.01, ###p < 0.001, compared with the control group; *p < 0.05, **p < 0.01, ***p < 0.001, compared with the model group. Data were shown as mean ± S.D, n = 35

FA and FB alleviated inflammation in zebrafish by inhibiting CuSO4-induced ROS and NO production. a Microphotographs exhibited ROS production in the control, model, FA, and FB groups (3 dpf wild-type AB strain zebrafish larvae). b FA and FB dose-dependently reduced ROS generation induced by CuSO4. c Microphotographs exhibited the production of NO in the control, model, FA, and FB groups (3 dpf wild-type AB strain zebrafish larvae). d FA and FB dose-dependently reduced NO generation induced by CuSO4. #p < 0.05, ##p < 0.01, ###p < 0.001, compared with the control group; *p < 0.05, **p < 0.01, ***p < 0.001, compared with the model group. Data were shown as mean ± S.D, n = 35

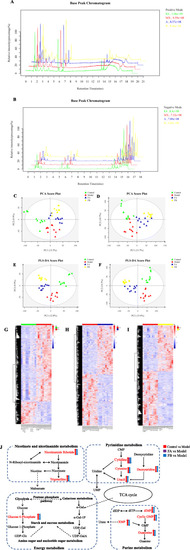
Metabolomic analyses of zebrafish larvae samples from the control, model, FA, and FB groups. Representative base peak chromatogram (BPC) of the control, model, FA, and FB groups in the positive ion mode (a) and negative ion mode (b). PCA score plot of metabolites in the positive ion mode (c) and negative ion mode (d). PLS-DA score plot of metabolites in the positive ion mode (e) and negative ion mode (f). Heat-map of differential metabolites of control vs. model (g), model vs. FA (h), and model vs. FB (i). Rows: differential metabolites; Columns: zebrafish larvae samples. The rectangle in different colors represented the expression level of metabolites: the highest (red), the lowest (blue), and the mean (white). j Metabolic pathways (bold) participating in the anti-inflammatory process of FA and FB against CuSO4-induced inflammation in zebrafish. The metabolites (red) were the identified biomarkers in the present study. Arrows near metabolites indicated the biomarkers’ relative expressions of control vs. model, model vs. FA, and model vs. FB

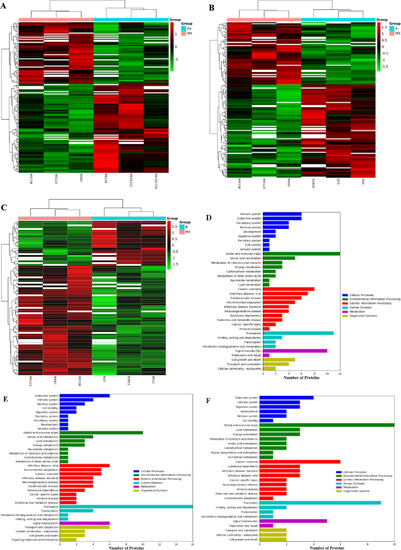
Proteomic analyses of zebrafish larvae samples from the control, model, FA, and FB groups. Heat-map of differential proteins of control vs. model (a), model vs. FA (b), and model vs. FB (c). Rows: differential proteins; columns: zebrafish larvae samples. The rectangle in different colors represented the expression level of proteins: the highest (red), the lowest (green), and the mean (white). The KEGG pathway classification of differential proteins of control vs. model (d), model vs. FA (e), and model vs. FB (f). Rows: number of proteins; columns: KEGG pathway classification

An integrated analysis of metabolomics and proteomics. The interactive network of metabolites and proteins from control vs. model (a), model vs. FA (b), and model vs. FB (c). Triangles and circles in different colors represented the associated metabolites and proteins, respectively

The relative mRNA expression levels in the control, model, FA, and FB groups. a The mRNA expressions of Wdr3, Nme3, Collagen, and Mrps7. b The mRNA expressions of IL-6, IL-1β, and TNF-α. c The mRNA expressions of genes involved in NF-κB, MAPK, and JAK-STAT signaling pathways. #p < 0.05, ##p < 0.01, ###p < 0.001, compared with the control group; *p < 0.05, **p < 0.01, ***p < 0.001, compared with the model group. Data were shown as mean ± S.D, n = 35

The possible mechanism of CuSO4-induced inflammation in zebrafish and the action diagram of FA and FB. FA and FB administration resulted in reductions of ROS and NO, alterations of various metabolites, proteins, and gene products induced by CuSO4, thereby reducing inflammation. This diagram showed the multi-component and multi-regulatory therapeutic mechanism of FA and FB against CuSO4-induced inflammation in zebrafish

Acknowledgments
This image is the copyrighted work of the attributed author or publisher, and ZFIN has permission only to display this image to its users. Additional permissions should be obtained from the applicable author or publisher of the image. Full text @ J Neuroinflammation