
- Title
-
Pilocarpine Induced Behavioral and Biochemical Alterations in Chronic Seizure-Like Condition in Adult Zebrafish
- Authors
- Paudel, Y.N., Kumari, Y., Abidin, S.A.Z., Othman, I., Shaikh, M.F.
- Source
- Full text @ Int. J. Mol. Sci.

Experimental flowchart elucidating the working protocol. |

Dose standardization study of pilocarpine in adult zebrafish. All the values were expressed as mean ± SEM and each data point was the average of 8 fish in each group ( |

Comparison of mean seizure score. All the values were expressed as mean ± SEM and each data point where the average of 10 fish in each group ( |
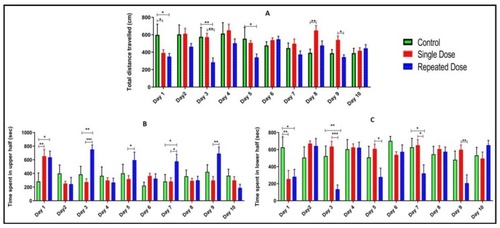
Total distance travelled, time spent in upper and lower half of the tank. All the values are expressed as mean ± SEM, and each data point shows the average of ten fish in each group ( |

Comparison of locomotor pattern and behavior of fish. Single dose and repeated dose of pilocarpine treatment versus normal control. Representative swimming patterns (behavior recording) for the corresponding three experimental groups ( |

Modulation of inflammatory (HMGB1, TLR4, NF-κB, TNF-α, and IL-1) and other markers (BDNF, CREB-1, and NPY). Expression level of inflammatory (HMGB1, TLR4, NF-κB, TNF-α and IL-1) and other markers (BDNF, CREB-1, and NPY) in the brain as determined by real time-PCR. The genes included are ( |

Modulation of Neurotransmitters levels in the normal and epileptic group. Neurotransmitters analysis in zebrafish brain after 10 days of pilocarpine treatment. GABA ( |
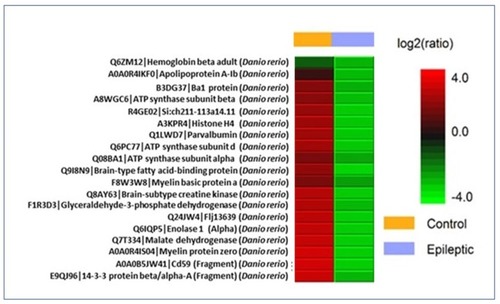
Differential expression (LFQ) of normal vs. epileptic zebrafish brain protein extract denoted by heat map. Label free quantification heat map for proteins identified from zebrafish brain (control vs. epileptic). Proteins with high ratio and low ratio are labelled red and green respectively. Samples are taken in triplicate where yellow line denotes epileptic group and light blue line denotes normal control group. |
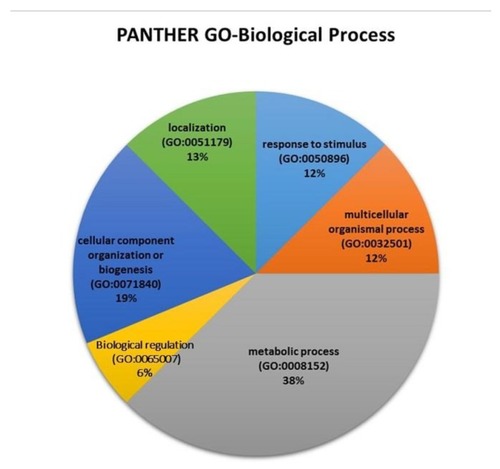
Biological process for the differentially expressed proteins. Biological processes for the differentially expressed proteins identified from the label free quantification approach. The pie chart was generated using PANTHER GO-classification system software. |