FIGURE SUMMARY
Title

Nanoplastics Cause Neurobehavioral Impairments, Reproductive and Oxidative Damages, and Biomarker Responses in Zebrafish: Throwing up Alarms of Wide Spread Health Risk of Exposure

Authors
Sarasamma, S., Audira, G., Siregar, P., Malhotra, N., Lai, Y.H., Liang, S.T., Chen, J.R., Chen, K.H., Hsiao, C.D.
Source
Full text @ Int. J. Mol. Sci.

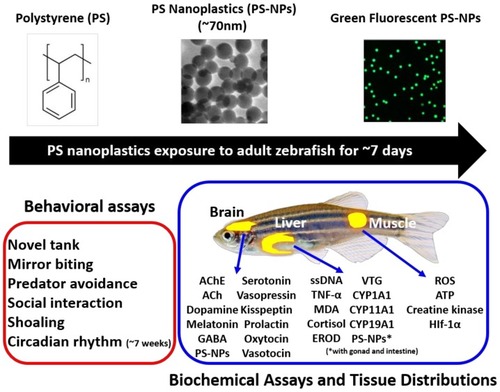
The experimental design to evaluate the ecotoxicity of polystyrene nanoplastics (PS-NPs). The chemical structure and particle size of polystyrene used in this study were summarized in the upper panel. The behavioral toxicity assays for PS-NPs were summarized in the left-right panel (red color). The biochemical endpoints for PS-NPs toxicity were summarized in the right lower panel (blue color).

Novel tank behavior endpoints comparisons between control and polystyrene nanoplastics (PS-NPs)-exposed zebrafish groups after a ~7-day exposure. (A) Average speed, (B) freezing time movement ratio, (C) number of entries to the top, (D) total distance traveled in the top, (E) time in top duration, and (F) latency to enter the top were analyzed. The 1 min. locomotion trajectories for the control, 0.5 and 1.5 ppm PS-NPs exposed fish in the novel tank test were presented in (G to L), respectively. The black line represents the control group, the red line represents the low concentration PS-NPs group (0.5 ppm), and the blue line represents the high concentration PS-NPs group (1.5 ppm). The data are expressed as the median with interquartile range and were analyzed by a Kruskal–Wallis test, which continued with Dunn’s multiple comparisons test as a follow-up test (n = 30 for control; n = 20 for each PS-NPs-exposed group; * p < 0.05, ** p < 0.01, *** p < 0.001).

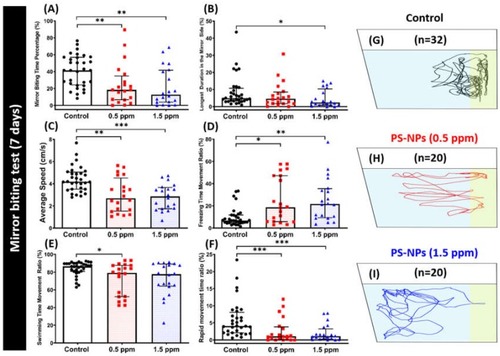
Mirror biting behavior endpoints comparisons between control and polystyrene nanoplastics (PS-NPs)-exposed zebrafish groups after a ~7-day exposure. (A) Mirror biting time percentage, (B) longest duration in the mirror side, (C) average speed, (D) freezing time movement ratio, (E) swimming time movement ratio, and (F) rapid movement time ratio were analyzed for mirror biting assay. The 1 min. locomotion trajectories for the control, 0.5 and 1.5 ppm PS-NPs-exposed fish in mirror biting tests were presented in G to I, respectively, with the yellow-colored zone as the mirror biting region. The data are expressed as the median with interquartile range and were analyzed by a Kruskal–Wallis test, which continued with Dunn’s multiple comparisons test as a follow-up test (n = 32 for control; n = 20 for each PS-NPs-exposed group; * p < 0.05, ** p < 0.01, *** p < 0.001).

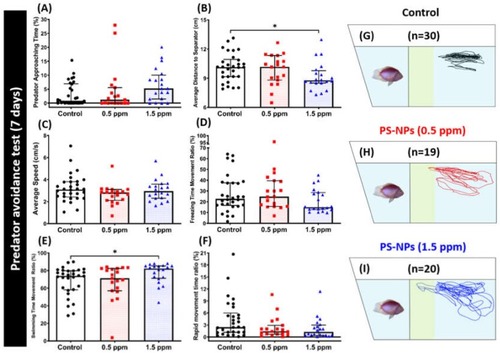
Predator avoidance behavior endpoints comparisons between control and polystyrene nanoplastics (PS-NPs)-exposed zebrafish groups after a ~7-day exposure. (A) Predator approaching time percentage, (B) average distance to the separator, (C) average speed, (D) freezing time movement ratio, (E) swimming time movement ratio, and (F) rapid movement time ratio were analyzed. The 1 min. locomotion trajectories for the control, 0.5 and 1.5 ppm PS-NPs exposed fish in the predator avoidance test were presented in G to I, respectively, with the yellow-colored zone as the predator approaching region. The data are expressed as the median with interquartile range and were analyzed by a Kruskal–Wallis test, which continued with Dunn’s multiple comparisons test as a follow-up test (n = 30 for control; n = 19 for 0.5 ppm PS-NPs-exposure fish; n = 20 for 1.5 ppm MP-exposure fish; p < 0.05).

Social interaction behavior endpoints comparisons between control and polystyrene nanoplastics (PS-NPs)-exposed zebrafish groups after a ~7-day exposure. (A) Interaction time percentage, (B) longest duration in the separator, (C) average speed, and (D) average distance to separator side were analyzed for social interaction assay. The 1 min. locomotion trajectories for the control, 0.5 and 1.5 ppm PS-NPs exposed fish in mirror biting tests were presented in E, F, G, respectively with the yellow-colored zone as the conspecific interaction region. The data are expressed as the median with interquartile range and were analyzed by a Kruskal-Wallis test, which continued with Dunn’s multiple comparisons test as a follow-up test (n = 30 for control; n = 20 for each PS-NPs-exposed group).

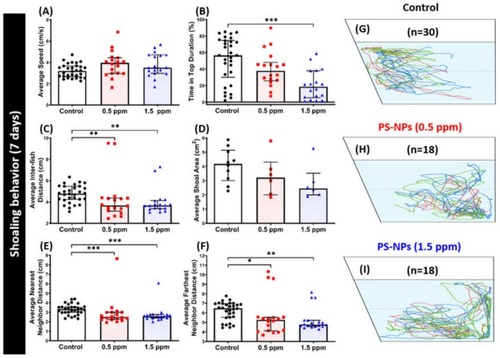
Shoaling behavior endpoint comparisons between the control and polystyrene nanoplastics (PS-NPs)-exposed zebrafish groups after a ~7-day exposure. (A) Average speed, (B) time in top duration, (C) average inter-fish distance, (D) average shoal area, (E) average nearest neighbor distance, and (F) average farthest neighbor distance, were analyzed. Groups of three fish were tested for shoaling behavior. The 1 min. locomotion trajectories for the control, 0.5 and 1.5 ppm PS-NPs exposed fish in shoaling tests were presented in G, H, I, respectively. The data are expressed as the median with interquartile range were analyzed by a Kruskal–Wallis test, which continued with Dunn’s multiple comparisons test as a follow-up test (n = 30 for control; n = 18 for PS-NP-exposed fish; * p < 0.05, ** p < 0.01, *** p < 0.005).

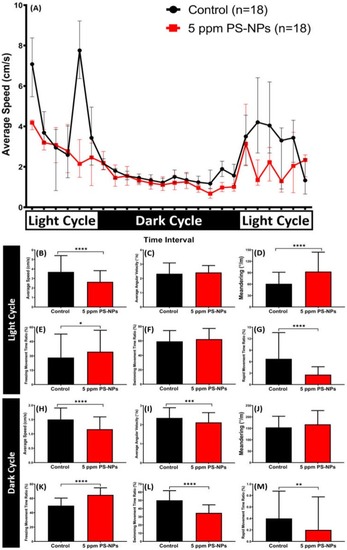
The circadian rhythm locomotion activity assay for control and 5 ppm polystyrene nanoplastics (PS-NPs)-exposed zebrafish groups after a seven-week exposure. (A) Comparison of the time chronology changes of the average speed between the control and the PS-NPs-exposed fish in light and dark cycles. The white area shows the light period and the black area shows the dark period. Comparison of the average speed (B,H), average angular velocity (C,I), and meandering (D,J), freezing movement time ratio (E,K), swimming movement time ratio (F,L), and rapid movement ratio (G,M) during the light and dark cycles, respectively. The data are expressed as the median with interquartile range and were analyzed by Mann–Whitney test (n = 18 for control; n = 18 for PS-NPs-exposed fish; * p < 0.05, ** p < 0.01, *** p < 0.001, ****, p < 0.0001).

Comparison of the tissue distribution of green fluorescence-labeled nanoplastics among different tissues in zebrafish after ~30 days of polystyrene nanoplastics (PS-NPs) exposure. The data are expressed as the mean ± SEM and they were analyzed by One-way ANOVA, which continued with post hoc analysis (n = 3; *** p < 0.001).

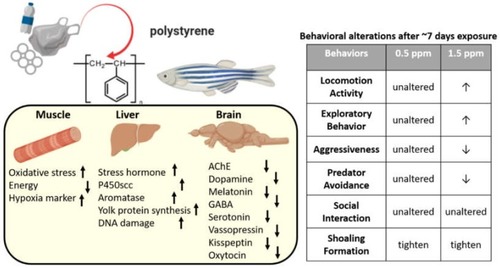
Schematic diagram of the biochemical and behavioral changes after polystyrene nanoplastics (PS-NPs) exposure in zebrafish. Left panel showing the biomarker expression alteration (↑: up regulated, ↓: down regulated) in the muscle, liver, and brain after PS-NPs exposure. Right panel showing the behavioral alteration after PS-NPs exposure at either 0.5 or 1.5 ppm (↑: higher behavior level, ↓: lower behavior level).

Acknowledgments
This image is the copyrighted work of the attributed author or publisher, and ZFIN has permission only to display this image to its users. Additional permissions should be obtained from the applicable author or publisher of the image. Full text @ Int. J. Mol. Sci.