
- Title
-
Identification and characterization of miRNAs involved in cold acclimation of zebrafish ZF4 cells
- Authors
- Ji, X., Jiang, P., Luo, J., Li, M., Bai, Y., Zhang, J., Han, B.
- Source
- Full text @ PLoS One
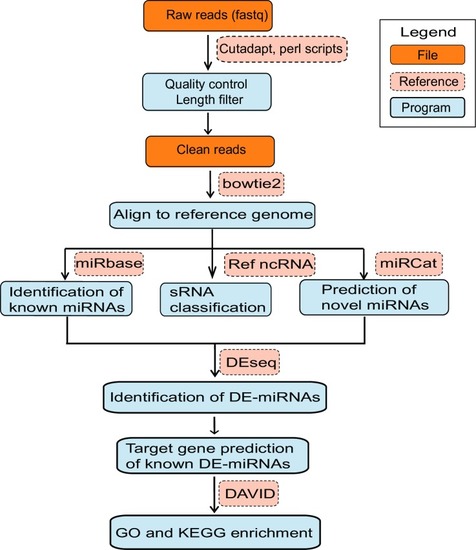
miRBase: microRNAs database, Ref ncRNA: reference non-coding RNA sequences, miRNAs: microRNAs, sRNAs: small RNAs, DE-miRNAs: differentially expressed miRNAs, DAVID: Database for Annotation, Visualization and Integrated Discovery, GO: Gene Ontology, KEGG: Kyoto Encyclopaedia of Genes and Genomes. |

Read length distribution of small RNA libraries (A) and nucleotides bias at each position of miRNA (B) for control or cold acclimation condition. (C) An overview of the frequency of different RNA species present in libraries from each group. miRNA: microRNA, unmatched: unmatched reads, rRNA: ribosomal RNA, lincRNA: long intergenic non-coding RNA, snoRNA: small nucleolar RNA, snRNA: small nuclear RNA, misc_RNA: miscellaneous RNA, Mt_tRNA: mitochondrial transfer RNA, Mt_rRNA: mitochondrial ribosomal RNA, scaRNA: small cajal body-specific RNA. |

(A) Comparison of miRNA expression levels between small RNA libraries from control and cold acclimated ZF4 cells. (B) Venn diagram shows the number of known miRNAs expressed only in control and cold acclimated ZF4 cells. (C) A heatmap was generated based on fold change values of known DE-miRNAs to visualize the expression patterns of the cold responsive miRNAs. (D) ZF4 cells were cultured at 18°C for 30 days, then returned to 28°C and cultured for another 10 days for recovery. The expression of indicated miRNAs was detected using qRT-PCR. The data are presented as means ± SD of three independent replicates. p <0.05 was considered to indicate a statistically significant result. *: p <0.05, **: p <0.01, ***: p <0.001. |

(A-B) GO and KEGG enrichment analyses of the target genes of DE miRNAs. The y-axis corresponds to GO/ KEGG pathway with a p-value ≤ 0.05, and the x-axis shows the enrichment ratio between the number of DE-genes and all unigenes enriched in a particular pathway. The color of the dot represents p-value, and the size of the dot represents the number of DE-genes mapped to the reference pathways. |
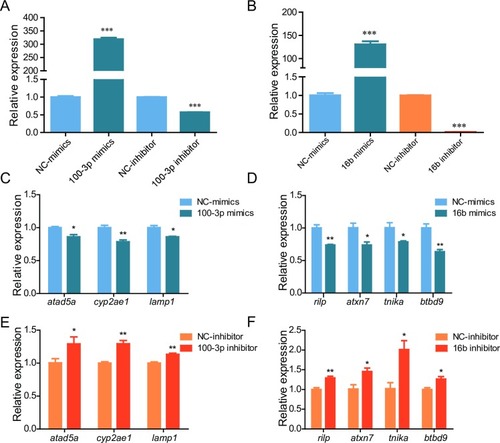
ZF4 cells were transfected with indicated mimics or inhibitor, 24 hours later the expression of miR-100-3p or miR-16b (A-B) and their target genes (C-F) was detected by qRT-PCR. NC: negative control. *: p <0.05, **: p <0.01, ***: p <0.001. |
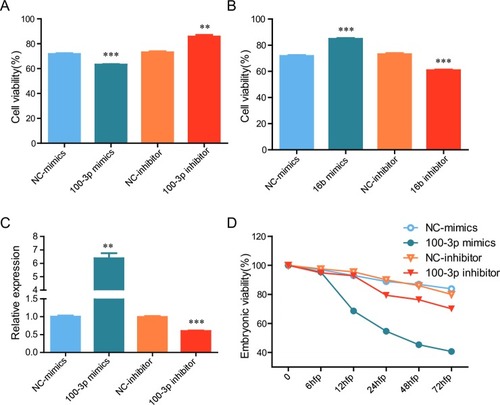
(A-B) ZF4 cells were transfected with indicated mimics or inhibitor, 24 hours later the cells were exposed to 10°C for 36 hours, then cell viability was examined. (C-D) Zebrafish embryos were microinjected with indicated mimics or inhibitor, 24 hours later the expression of miR-100-3p was detected by qRT-PCR (C), and viability of embryos was determined (n = 120) (D). *: p <0.05, **: p <0.01, ***: p <0.001. NC, negative control. |