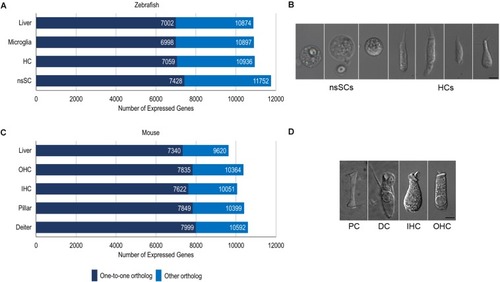
Cell type-specific gene expression in zebrafish and mouse. (A) The total number of expressed gene orthologs (RPKM ≥ 0.10, FDR-adjusted p-value ≤ 0.10) in zebrafish nsSCs, HCs, microglia, and liver. The number of expressed one-to-one orthologs out of the total number of classified orthologs is shown in dark blue. (B) Representative images of zebrafish nsSCs and HCs; Bar: 5 μm. (C) The total number of expressed gene orthologs (RPKM ≥ 0.10, FDR-adjusted p-value ≤ 0.10) in mouse DCs, PCs, IHCs, OHCs, and liver cells. (D) Representative image of a mouse PC, DC, IHC, and OHC; Scale bar: 5 μm (adapted from Liu et al., 2014).

Acknowledgments
This image is the copyrighted work of the attributed author or publisher, and ZFIN has permission only to display this image to its users. Additional permissions should be obtained from the applicable author or publisher of the image. Full text @ Front. Neurosci.