
- Title
-
The psychoactive cathinone derivative pyrovalerone alters locomotor activity and decreases dopamine receptor expression in zebrafish (Danio rerio)
- Authors
- Souders, C.L., Davis, R.H., Qing, H., Liang, X., Febo, M., Martyniuk, C.J.
- Source
- Full text @ Brain Behav

Oxygen consumption rates (pmol min−1 embryo−1) in zebrafish embryos exposed to pyrovalerone for 24 hr. Each point represents a mean value ± |
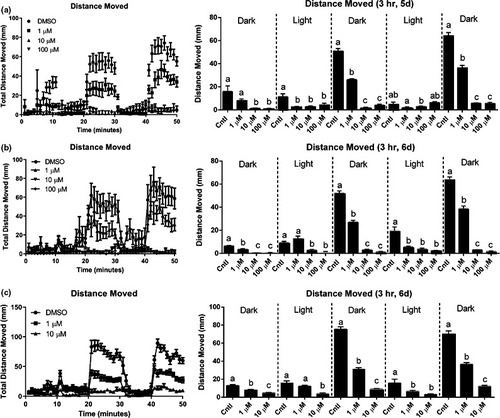
Locomotor analysis of distance moved over the 50 min during a visual motor response (VMR) test after 3‐hr treatment to pyrovalerone. Each graph (left and right) represents an independent experiment. Group mean of the distance‐moved (mm)‐per‐minute intervals for fish (right panel). Total distance moved in each interval of the light and dark. Data are presented as mean value ± |

Locomotor analysis of distance moved over the 50 min during a visual motor response (VMR) test after 24‐hr treatment to pyrovalerone. Group mean of the distance‐moved (mm)‐per‐minute intervals for fish (right panel). Total distance moved in each interval of the light and dark. Data are presented as mean value ± |

The expression levels of |