
- Title
-
Disruption of the pancreatic vasculature in zebrafish affects islet architecture and function
- Authors
- Mullapudi, S.T., Boezio, G.L.M., Rossi, A., Marass, M., Matsuoka, R.L., Matsuda, H., Helker, C.S.M., Yang, Y.H.C., Stainier, D.Y.R.
- Source
- Full text @ Development
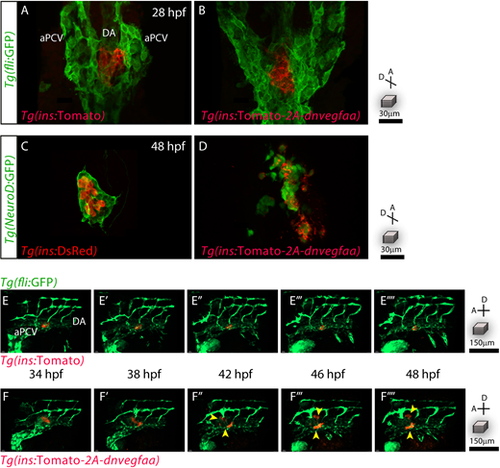
β-Cell-specific dnVegfaa expression disrupts pancreatic islet architecture. (A,B) Pancreatic β-cells (red) and the endothelial cells (green) in 28 hpf Tg(ins:Tomato); Tg(fli:GFP) and Tg(fli:GFP); Tg(ins:dnvegfaa) embryos, viewed ventrally. (C,D) Pancreatic endocrine cells (green) and β-cells (red) in 48 hpf Tg(NeuroD:GFP); Tg(ins:DsRed) and Tg(NeuroD:GFP); Tg(ins:dnvegfaa) embryos, viewed ventrally. (E-F) Confocal projection images of Tg(ins:Tomato); Tg(fli:GFP) and Tg(ins:dnvegfaa); Tg(fli:GFP) embryos from 34 to 48 hpf, viewed laterally. Yellow arrowheads point to dispersing β-cells. Maximum intensity projections are presented. A, anterior; D, dorsal. PHENOTYPE:
|

dnVegfaa exerts a dose-dependent effect on β-cell dispersion. (A) β-Cells (green) from 48 hpf Tg(ins:GFP) embryos with mosaic Tg(ins:dnvegfaa) expression. The percentage of β-cells expressing dnvegfaa (magenta) is indicated, as is the severity of islet dispersion (intact, moderate or severe; white). (B) Quantification of embryos displaying varying severity of islet dispersion. (C-J) Immunostaining for insulin (β-cells, red) and endothelial cells (green) in 48 hpf Tg(fli:GFP) embryos, in combination with the indicated transgenic or mutant line, n=3-5 animals per genotype. Maximum intensity projections are presented. A, anterior; D, dorsal. PHENOTYPE:
|

sFlt1 expression in β-cells severely impairs their function. (A-C) Confocal projection images of the vasculature (white) in 120 hpf Tg(fli:GFP) larvae, in combination with the indicated transgenic line. Yellow dashed lines outline the pancreas. A′-C′ show the endothelial cells. (A″-C″) Confocal planes of β-cells (red) and the surrounding vasculature (white) in 120 hpf Tg(fli:GFP) larvae, in combination with the indicated transgenic line. (D) Percentage of β-cells responsive to physiological (−Glucose) and exogenous (+Glucose) glucose, measured as visual fluctuations in fluorescence in 120 hpf Tg(ins:GCaMP5) larvae, n=5-17 animals. (E) Glucose levels in 120 hpf animals, n=4-6 replicates, 10 animals per replicate. Data are mean±s.e.m; individual data points are shown. P-values from t-tests are presented. A, anterior; D, dorsal. |
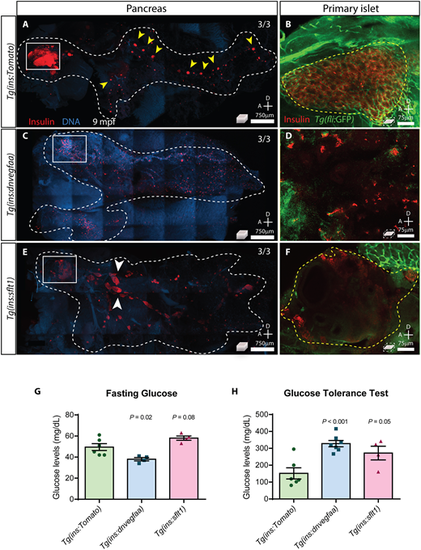
β-Cell-specific expression of dnVegfaa or sFlt1 influences islet architecture and function in adult stages. (A,C,E) Whole-mount immunostaining for β-cells (insulin, red) in pancreas (white dashed outline) and intestine from 9 months postfertilization (mpf) zebrafish after CLARITY-based tissue clearing. Yellow arrowheads point to secondary islets along the pancreatic duct. White arrowheads point to sheets of β-cells along the ducts observed in Tg(ins:sflt1) animals. Maximum projection images are presented. (B,D,F) Whole-mount immunostaining for β-cells (insulin, red) and vasculature (green) in the primary pancreatic islet (magnification of white boxed areas in A,C and E, respectively). Images are single confocal planes. Yellow dashed line outlines the primary pancreatic islet. (G) Fasting blood glucose levels in adult zebrafish, measured after three days of fasting, n=4-6 animals. (H) Blood glucose levels in adult zebrafish, 90 min after intraperitoneal administration of a glucose bolus, n=4-7 animals. Data are mean±s.e.m.; individual data points are shown. P-values from t-tests are presented. A, anterior; D, dorsal. |