
- Title
-
Impaired Mitochondrial ATP Production Downregulates Wnt Signaling via ER Stress Induction
- Authors
- Costa, R., Peruzzo, R., Bachmann, M., Montà, G.D., Vicario, M., Santinon, G., Mattarei, A., Moro, E., Quintana-Cabrera, R., Scorrano, L., Zeviani, M., Vallese, F., Zoratti, M., Paradisi, C., Argenton, F., Brini, M., Calì, T., Dupont, S., Szabò, I., Leanza, L.
- Source
- Full text @ Cell Rep.

Mitochondrial Fitness Fine-Tunes Wnt Signaling in Human Embryonic Kidney HEK293 Cells and in Wnt-Dependent Reporter Zebrafish (A) Canonical Wnt signaling activity based on TCF-LEF-dependent transcription was assayed in HEK293 cells. These cells were either left untreated or Wnt signaling was enhanced using 3 μM CHIR99021 (CHIR). Cells were then treated for 8 h with the following compounds: 0.1% DMSO, as negative control; 10 μM XAV939 (XAV) as positive control; MgTx, ShK, ChTx (1 μM); PAP-1 (20 μM) + cyclosporin H (CSH) (4 μM); 1 μM PAPTP, 5 μM PCARBTP; 5 μM salinomycin (Salino), 0.5 μM nigericin (Nige), 1 μM valinomycin (Valino); and 2 μM FCCP; 5 μM rotenone (Rot), 0.5 mM TTFA, 1.8 μM antimycin A (Anti), and 1.2 μM oligomycin (Oligo). The luciferase signal was normalized with respect to the signal given by β-gal, which was co-transfected with TOPflash plasmid. The values are reported as the percentage of luciferase signal related to the “ref.” Values are means ± SEMs (n = 8). (B and C) Reduction of protein levels of β-catenin and its target genes LEF1 and MET are shown in representative western blots (B). Densitometric analysis (n = 6; means ± SEMs) is reported in (C). (D and E) GFP fluorescent zebrafish Tg(7xTCFX.lasiam:EGFP)ia4 Wnt-dependent reporter fishes were treated for 15 h with the following compounds: DMSO 0.2%, 20 μM XAV, 1 μM Salino, 1.5 μM PAPTP, 5 μM PCARBTP, 50 μM TTFA, and 0.12 μM Oligo. Representative bright-field and epifluorescence microscopy images are reported in (D), while fluorescence quantification is shown in (E) (means ± SEMs). The numbers reported on the graph represent the number of zebrafish embryos treated for each condition. Bars, 1.5 mm. (F) Zebrafish β-catenin (Zβ-catenin) protein level from embryos treated as (D) and (E) was determined by western blot. The quantification is reported below. The values are indicated as the percentage of the “ref” (n = 3; means ± SEMs). Statistical significance (ANOVA) was determined as ∗p < 0.05, ∗∗p < 0.01, and ∗∗∗p < 0.001. |

Mitochondrial Fitness Fine-Tunes Wnt Signaling in Human Fibroblasts and in Respiratory Chain Complex III Deficiency Zebrafish Models (A) Reduction of the protein levels of β-catenin and its target genes TCF7 and CD44 and endoplasmic reticulum stress induction was observed in human immortalized fibroblasts. Protein extracts obtained from healthy donors (WT) or GRACILE patients (bcs1lR73C/F368I) were used. A representative blot and quantification are shown (left and right, respectively; n = 3; means ± SEMs). (B) Total protein extracts from human immortalized fibroblasts from healthy donors treated overnight with 0.2% DMSO or 1 μM Anti were analyzed by western blot. The quantification is shown at right (n = 3; means ± SEMs). (C) Transient knockdown of the respiratory chain complex III was performed by two independent splicing morpholinos against Ttc19 and Bcs1l mRNAs (Ttc19 spMO and Bcs1l spMO); a standard control morpholino was also used. Bright-field images of morphants are reported. Bars, 1 mm. (D) Respiratory efficiency of morpholino-injected embryos (pool of 15 embryos) was analyzed by the Oxygraph+ instrument. Oxygen concentration in the medium and the consumption rate are plotted. (E) Knock down of the respiratory complex III was performed in Tg(7xTCFX.lasiam:GFP)ia4 by Ttc19 spMO and Bcs1l spMO and compared to the control. GFP epifluorescence quantification was reported in the graph below; dots and numbers represent treated embryos (means ± SEMs). Statistical significance (ANOVA) was determined as ∗p < 0.05, ∗∗p < 0.01, and ∗∗∗p < 0.001). Bars, 1 mm. (F) Mito-Wnt axis is an important pathway in which mitochondrial dysfunction (1), due to mutated genes or to pharmacological treatment, leads to reduced mitochondrial ATP synthesis, which directly affects Ca2+ uptake by regulating SERCA in the endoplasmic reticulum (2). This in turn decreases Ca2+ levels in the endoplasmic reticulum (3), leading to endoplasmic reticulum stress induction by the phosphorylation of eIF2α and activation of its downstream factors ATF4 and CHOP (4), which are able to modulate Wnt signaling by a still-debated mechanism (5). This modulation could regulate several downstream events such as gene transcription of Wnt target genes, leading to the control of cell proliferation, metabolic adaptation, and cell migration, in particular, modulating cancer development and the spreading of metastasis (6). Finally, a possible feedback mechanism of reduced Wnt signaling can further regulate mitochondrial activity (7). As indicated by experiments shown in Figure S2D, glycolysis also contributes to the regulation of Ca2+ uptake into the endoplasmic reticulum. |
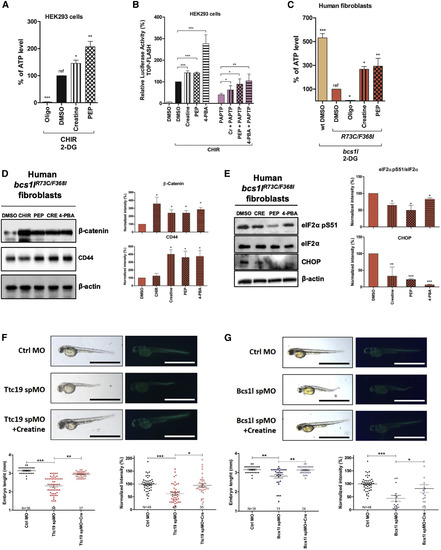
Increased Mitochondrial ATP Production or Endoplasmic Reticulum Stress Inhibition Rescues Wnt Signaling (A) Mitochondrial ATP content was measured in HEK293 cells, after treatment with 1 mM creatine (CRE) or 60 μM phosphoenolpyruvate (PEP) for 30 min. Furthermore, Wnt signaling was induced by co-administration of 3 μM CHIR. The analysis was conducted as in Figure 2A (n = 3; means ± SEMs). (B) Canonical Wnt signaling activity based on TCF-LEF-dependent transcription was assayed in HEK293 cells, as in Figure 1A. Cells were pre-treated for 30 min with CRE or phosphoenolpyruvate or for 2 h with 0.5 mM of the endoplasmic reticulum stress inhibitor 4-phenyl butyric acid (4-PBA) before addition and incubation with or without 1 μM PAPTP for a further 8 h (n = 3; means ± SEMs). (C) Mitochondrial ATP was measured and analyzed in human immortalized fibroblasts from healthy donors (WT) or a GRACILE patient (n = 3). Cells were pre-treated as in (A). (D) β-Catenin and CD44 recovery were measured in bcs1lR73C/F368I fibroblasts by western blot after treatment with the following compounds: 3 μM CHIR, 1 mM CRE, 0.6 mM phosphoenolpyruvate, or 0.5 mM 4-PBA. (E) Endoplasmic reticulum stress rescue was measured in bcs1lR73C/F368Ifibroblasts. Representative blots are shown at left, while the quantification is reported at right (n = 3; means ± SEMs). (F and G) Zebrafish morphants for Ttc19 (F) and Bcs1l (G) were obtained as in Figures 3C and 3E. Bright-field images of morphants as well as reporter GFP epifluorescence are shown. The sagittal length and GFP epifluorescence quantification of embryos are reported in the graph below (means ± SEMs; dots and numbers represent treated embryos). Bars, 1.5 mm. Statistical significance (ANOVA) was determined as ∗p < 0.05, ∗∗p < 0.01, and ∗∗∗p < 0.001. |