
- Title
-
Rubicon-Dependent Lc3 Recruitment to Salmonella-Containing Phagosomes Is a Host Defense Mechanism Triggered Independently From Major Bacterial Virulence Factors
- Authors
- Masud, S., van der Burg, L., Storm, L., Prajsnar, T.K., Meijer, A.H.
- Source
- Full text @ Front Cell Infect Microbiol
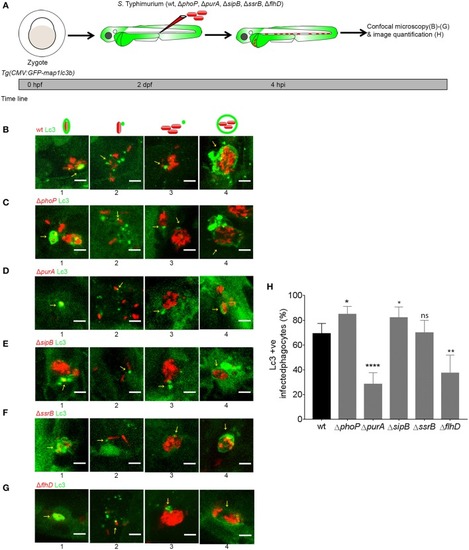
Host LAP response to S. Typhimurium mutants. (A) Work flow and time line of experiments followed in (B–H). (B–G) Representative confocal micrographs of GFP-Lc3 positive infected phagocytes with mCherry-labeled S. Typhimurium mutant strains wild type (B), ΔphoP (C), ΔpurA (D), ΔsipB (E), ΔssrB (F), and ΔflhD(G). Yellow arrows indicate GFP-Lc3 associations with bacterial cells and numbers 1–4 represent four different examples of Lc3 association patterns for each S. Typhimurium mutant strain. At the top of each column of images is a symbolic representation of the pattern of GFP-Lc3 and bacterial cell association as reported earlier (Masud et al., 2019). (H) Quantification of GFP-Lc3-Salmonella association for S. Typhimurium mutant strains ΔphoP, ΔpurA, ΔsipB, ΔssrB, and ΔflhD along with wild type SL1344 at 4 hpi. Numbers of infected phagocytes positive or negative for GFP-Lc3-Salmonella associations were counted from confocal images and the percentages of Lc3-positive (Lc3+ve) over the total were averaged from five embryos per group. Error bars represent the SD. One of the two replicates is shown. Scale bar (B–G) = 5 μm, ****P < 0.0001, **P < 0.01, *P < 0.05, ns, non-significant. |
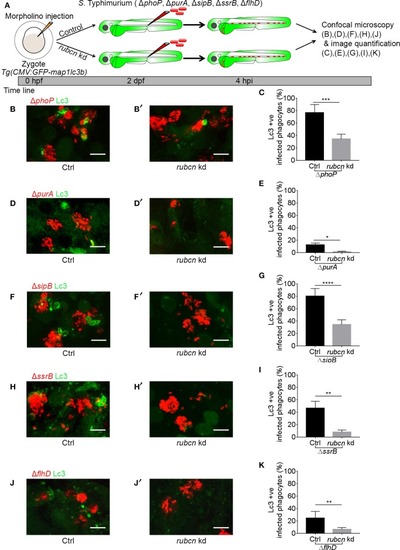
Host LAP response to S. Typhimurium mutants in Rubicon-depleted embryos. (A) Work flow and time line of experiments in (B–K). (B,D,F,H,J) Representative confocal micrographs of GFP-Lc3 positive infected phagocytes with mCherry-labeled S. Typhimurium mutant strains ΔphoP (B), ΔpurA (D), ΔsipB (F), ΔssrB(H), and ΔflhD (J) in Rubicon-depleted hosts (B',D',F',H',J') along with respective controls (B,D,F,H,J). (C,E,G,I,K) Quantification of GFP-Lc3-Salmonella association for S. Typhimurium mutant strains ΔphoP (C), ΔpurA (E), ΔsipB (G), ΔssrB (I), and ΔflhD (K) in Rubicon-depleted larvae and their respective controls. Numbers of infected phagocytes positive or negative for GFP-Lc3-Salmonella associations were counted from confocal images and the percentages of Lc3-positive over the total were averaged from five embryos per group. Error bars represent the SD. One of the two replicates is shown. Scale bar (B,D,F,H,J) = 10 μm, ****P< 0.0001, ***P < 0.001, **P < 0.01, *P < 0.05. |