FIGURE SUMMARY
Title

Artery-vein specification in the zebrafish trunk is pre-patterned by heterogeneous Notch activity and balanced by flow-mediated fine tuning

Authors
Geudens, I., Coxam, B., Alt, S., Gebala, V., Vion, A.C., Meier, K., Rosa, A., Gerhardt, H.
Source
Full text @ Development


  • Notch mediates the local patterning of the trunk vasculature. (A) Quantification of the ratio of arterial and venous ISVs in a 10-somite region of the trunk of 6 dpf wild-type embryos (n=3 experiments, 74 embryos, 1480 ISVs). (B) Ipsilateral neighbourhood analysis of vessel identity with two neighbours in 6 dpf wild-type embryos (n=3 experiments, 74 embryos, 1184 ISVs). (C) Contralateral neighbourhood analysis of vessel identity in 6 dpf wild-type embryos (n=3 experiments, 74 embryos, 1480 ISVs). (D) Stills from time-lapse movie ( Movie 1) of a Tg[fli1a:EGFP]y1/Tg[-0.8flt1:RFP]hu5333 embryo showing ISV remodelling into a venous (left) and an arterial (right) intersegmental vessel (vISV and aISV). The double transgenic labelling with GFP expression in all ECs and RFP expression in arterial ECs facilitates distinction between arterial (yellow) and venous (green) structures. In both cases, a lumenised connection is formed between the secondary sprout and the primary ISV (arrowheads). Magnifications show lumenised connections in a future vISV (1) and a future aISV (2). In the case of the formation of an aISV, the connection is lost again and the secondary sprouts form lymphatic precursors at the horizontal myoseptum (parachordal lymphangioblasts, PL). In case of vISV remodelling, the secondary sprout connection is stabilised and the connection between primary ISV and DA regresses. (E) Tg[fli1a:EGFP]y1 embryos mosaically expressing a pT2Fli1ep-zN1aICD-basfli-mCherry construct (NICDOE) at 50 hpf. Lymphangiogenic sprouts, i.e. sprouts delivering lymphatic precursors at the horizontal myoseptum (arrowheads), can be observed at the position of NICD overexpressing (NICDOE) ISVs (asterisks). Arrow points to a venous ISV connection. (F) Tg[fli1a:EGFP]y1 embryos mosaically expressing a pT2Fli1ep-zN1aICD-basfli-mCherry construct at 6 dpf. NICDOE mCherry-positive cells were found almost exclusively in the arterial compartment of the vasculature. (G) Quantification of the ratio of arterial and venous ISVs in a 10-somite trunk region of 6 dpf control embryos (n=3 experiments, 74 embryos) and mosaic NICDOE embryos (n=3 experiments, 51 embryos). In mosaic embryos, the arterio-venous distribution was quantified overall and separately in NICDOE and wild-type ISVs. Wild-type ISVs compensate for the forced arterialisation of NICDOE ISVs by increased formation of venous connection. (H) Quantification of the percentile presence of arterial and venous ISVs in a 10-somite region of the trunk of 6 dpf NICDOE embryos. Mosaic NICDOE embryos represented in G were grouped based on their relative number of NICDOE ISVs (<20%, 20-30% or >30%; n=13, 26 and 12 embryos, respectively). (I) Ipsilateral neighbourhood analysis of vessel identity with two neighbours in 6 dpf NICDOE embryos (n=3 experiments, 40 embryos, 592 ISVs) compared with wild-type embryos (n=3 experiments, 74 embryos, 1184 ISVs). A, artery; DA, dorsal aorta; PCV, posterior cardinal vein; ISV, intersegmental vessel; PL, parachordal lymphangioblasts; V, vein; WT, wild type; NICDOE, NICD overexpressing. Scale bars: 50 μm.


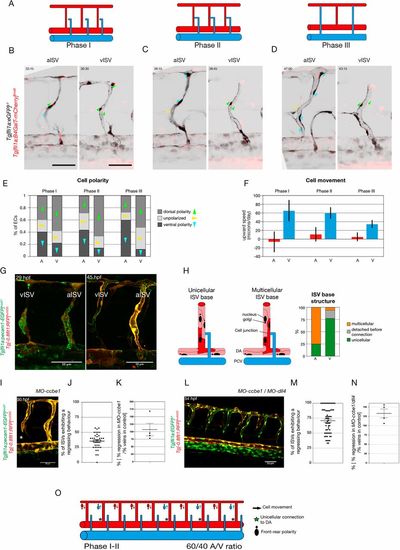
Primary ISVs are specified into aISVs and vISVs prior to connection by secondary sprouts originating from the PCV. (A) Schematic representation of the three phases of primary ISV remodelling: phase I, before secondary sprout connection to the primary ISV; phase II, when a lumenised connection is formed between the secondary sprout and the primary ISV; phase III, when the three-way connection resolves into aISV or vISV. (B-D) Stills from time-lapse movies (see Movies 4 and 5) of EC polarity in aISVs and vISVs of Tg[fli1a:GFP]y1;Tg[fli1a:B4GalT-mCherry]bns9 embryos during the three different phases: (I) before secondary sprout connection, (II) during three-way connection and (III) after resolution. Arrowheads indicate the angle from the centre of the nucleus to the centre of the Golgi complex: green indicate dorsal polarity; blue indicate ventral polarity; yellow indicate unpolarised ECs. (E) Quantification of EC polarity in aISVs (n=7 aISVs, 16 cells) and vISVs (n=8 vISVs, 17 cells) of Tg[fli1a:GFP]y1;Tg[fli1a:B4GalT-mCherry]bns9 embryos during the three different phases: (I) 2.5 h before secondary sprout connection; (II) during three-way connection; and (III) 2.5 h after resolution. (F) Quantification of EC upward speed (in microns/day) in aISVs (n= 12 aISVs, 67 cells) and vISVs (n=13 vISVs, 103 cells) during the three different phases: (I) 1 h before secondary sprout connection; (II) during three-way connection; and (III) 1 h after resolution. (G) Stills from time-lapse movie (Movie 6) of a Tg[fli1a:pecam1-EGFP]ncv27;Tg[-0.8flt1:RFP]hu5333 embryo showing ISV remodelling into an arterial and a venous intersegmental vessel (aISV and vISV) at 29 and 45 hpf. (H) Quantification of the cellular structure at the base of the primary ISV at the inception of phase II. Detection or absence of GFP expression is used to characterise the nature of the connection (unicellular or multicellular) (n=34 embryos, 12 aISVs, 40 vISVs). (I) Still from a time lapse movie (see Movie 7) of a Tg[fli1a:pecam1-EGFP]ncv27; Tg[-0.8flt1:RFP]hu5333 5 ng MO-ccbe1 embryo showing ISV regression in the absence of secondary sprouting. (J) Quantification of the percentage of primary ISVs exhibiting a regression behaviour (full disconnection from the DA, thin membrane connection to the DA, lumen collapse and reconnection, and cell death at the base of the primary ISV; see Fig. S3) (n=4 experiments, 37 morphants, 241 morphant vessels). (K) Quantification of percentage of primary ISVs exhibiting a regression behaviour in ccbe1 morphants compared with the percentage of veins in control clutch mates (n=37 morphants, n=29 wild-type controls). (L) Stills from time-lapse movie (Movie 8) of a Tg[fli1a:EGFP]y1;Tg[-0.8flt1:RFP]hu5333 5 ng MO-ccbe1/10 ng MO-dll4 embryo showing ISV regression in the absence of secondary sprouting. (M) Quantification of percentage of primary ISV exhibiting a regression behaviour (full disconnection from the DA, thin membrane connection to the DA, lumen collapse and reconnection, and cell death at the base of the primary ISV; see Fig. S2) (n=7 experiments, 62 morphants, 531 morphant vessels). (N) Quantification of percentage of primary ISVs exhibiting a regression behaviour in MO-ccbe1(5 ng)/MO-dll4 (10 ng) double morphants compared with the percentage of veins in control clutch mates (n=62 morphants, n=17 wild-type controls). (O) Schematic representation of ISV specification prior to and at the inception of the three-way connection, quantifiable through EC polarity, upward movement speed and cellular structure at the connection to the dorsal aorta. A, aISV; V, vISV. Scale bars: 50 μm. In J,K,M,N, data are mean± s.e.m. with individual data points indicated.


  • The majority of primary ISVs are not perfused prior to connection to the secondary sprouts originated from the PCV. (A) Stills from time-lapse movie of the trunk region of a Tg[fli1a:EGFP]y1embryo showing perfusion with Qtracker 705 quantum dots between 33 and 34:20 hpf. (B) Stills from time-lapse movie of a Tg[fli1a:EGFP]y1 embryo at time of connection of a primary ISV to a secondary sprout (transition from phase I to phase II) injected with Qtracker 705 quantum dots 705 fluorescent beads. (C) Quantification of primary ISV perfusion in phase I and at time of connection to the secondary sprout (phase I/phase II transition). Phase I perfusion is quantified 1 h before connection to the secondary sprout. Perfusion is defined by the continuous labelling of the lumen area ISV with the quantum dots and visible presence of a probable inlet and outlet for flow (n=13 embryos, 23 vISVs, 11 aISVs). (D) Stills from time-lapse movie of a Tg[fli1a:EGFP]y, Tg[gata1a:dsRed]sd2 embryo (labelling ECs in green and blood cells in red) at time of connection of a primary ISV to a secondary sprout (transition from phase I to phase II) (representative of n=7 embryos, 7 aISVs, 11 vISVs). Scale bars: 50 μm.


  • Notch signalling mediates early primary ISV specification. (A) Quantification of ECs upward speed (in microns/day) in ISVs of wild-type [n=12 aISV (67 cells), 13 vISV (103 cells)], NICDOE(n=30 aISV, 29 NICDOE cells) and MO-dll4 (n=9 vISV, 85 cells) embryos (32 to 54 hpf) at three different time points: (I) 2.5 h before secondary sprout connection; (II) during three-way connection; and (III) 2.5 h after resolution of the three-way connection. (B,C) Notch activity reporter Tg[tp1-MmHbb:kaede]um15;Tg[kdr-l:ras-Cherry]s916 imaged at 52 hpf (B) and at 6 dpf (C) in the same embryo, after conversion of the Kaede photoconvertible fluorescent protein at 29 hpf (Notch activity reporter shown in green, all ECs labelled in red). Red arrowheads indicate ISVs expressing high levels of the Kaedegreen protein, both at 52 hpf and at 6 dpf. (D) Quantification of the ratio of arteries and veins, determined at 6 dpf, correlated to the Notch activity status at 52 hpf, after conversion of the Kaede photoconvertible fluorescent protein at 29 hpf [tp1 positive, negative or high (as indicated by red arrowheads in B)] (n=20 embryos; *P<0.0001, two-way ANOVA). (E) Quantification of the percentage of tp1-positive (tp1+) and tp1-negative (tp1−) ISVs in untreated (n=20 embryos) versus 2×tricaine-treated (tric 2×) embryos (n=12 embryos) at 52 hpf, after conversion of the Kaede photoconvertible fluorescent protein at 29 hpf. Flow inhibition between 29 and 52 hpf does not affect tp1 promoter activity during this period. (F) Quantification of the ratio of arteries and veins, determined at 6 dpf, correlated to the Notch activity status at 52 hpf (tp1 positive or tp1 negative), in untreated (n=20 embryos) versus 2×tricaine-treated embryos (n=12 embryos). Flow inhibition does not affect the balance of arteries and veins formed from tp1-positive ISVs, but tp1-negative ISVs form significantly more arteries after tricaine treatment (*P=0.027, two-way ANOVA). (G) Ipsilateral neighbourhood analysis of Notch activity status of vessels with two neighbours in 52 hpf embryos after conversion of the photoconvertible Kaede protein at 29 hpf. Graph shows the frequency of finding a tp1-positive or -negative ISV, given the Notch activity status of the neighbouring ISVs [tp1 positive (+) or tp1 negative (−)] (n=19 embryos, 199 ISVs) (*P<0.0001, one-way ANOVA). (H) Quantification of the ratio of arterial ISVs with activated Notch signalling first detectable (as indicated by tp1 signal) before connection of the secondary sprout (i.e. during phase I) or after connection of the secondary sprout (i.e. during phase II) (n=22 ISVs). Data are mean±s.e.m. NS, not significant. Scale bars: 100 μm.


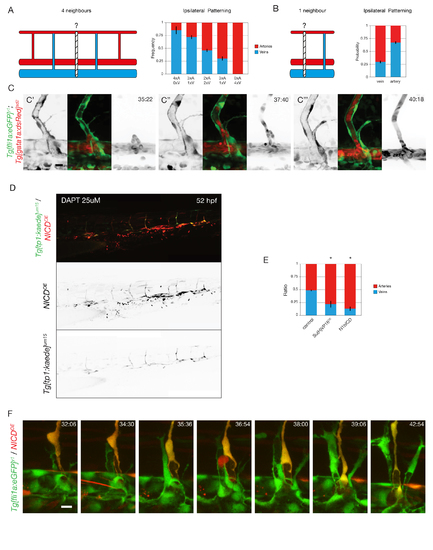
A) Ipsilateral neighborhood analysis of vessel identity with 4 neighbors in 6 dpf WT embryos (N=3 experiments, 74 embryos, 888 ISVs).

B) Ipsilateral neighborhood analysis of vessel identity with 1 neighbor in 6 dpf WT embryos (N=3 experiments, 74 embryos, 1332 ISVs).

C) Stills from time-lapse movie (Supplementary Movie S2) in Tg[fli1a:GFP]y1;Tg[gata1a:DsRed]sd2 labeling ECs in green and blood cells in red showing formation of a transient perfused three-way connection (C’-C”) as circulating blood cells can be observed in the DA-ISV-secondary sprout-PCV shunt. In panel C”’ it is clear that the ISV-PCV connection is disconnected again and the secondary sprout takes part in lymphatic development, whereas strong dorsal flow is established in the arterial ISV.

D) Tg[tp1-MmHbb:kaede]um15 embryo mosaically expressing a pT2Fli1ep-zN1aICD-basflimCherry construct (NICDOE) at 52 hpf. Endogenous Notch activity was blocked by treatment with 25μM DAPT from 24 till 52 hpf in order to observe Notch activation by NICD overexpression.

E) Quantification of the ratio of arterial and venous ISVs containing cells overexpressing Su(H)VP16, a constitutively active variant of the Su(H) transcription factor (Su(H)VP16OE) (N=3 experiments, 29 embryos) or mosaically overexpressing Notch-1bICD (N1bICDOE), the intracellular domain of Notch1b, the paralogue of Notch1a (N=2 experiments, 43 embryos). (*P=0.0001)

F) Stills from time-lapse movie (Supplementary Movie S3) in Tg[fli1a:GFP]y1 embryos mosaically overexpressing a pTol2-zN1aICD-basfli-mCherry construct showing formation of a transient perfused three-way connection between a wild-type secondary sprout and a NICD overexpressing (NICDOE) primary ISV, indicating that Notch activation does not prevent

interaction between primary ISVs and secondary sprouts.

Acknowledgments
This image is the copyrighted work of the attributed author or publisher, and ZFIN has permission only to display this image to its users. Additional permissions should be obtained from the applicable author or publisher of the image. Full text @ Development