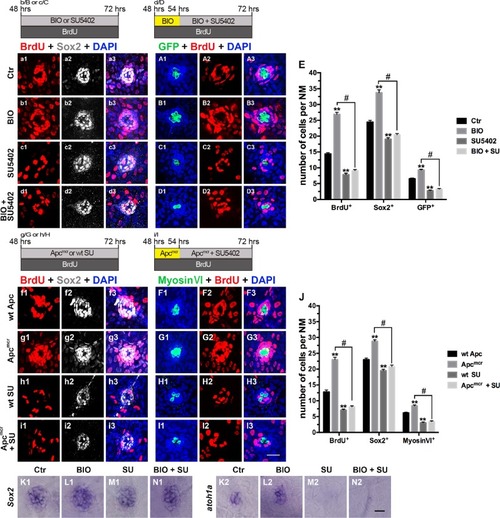
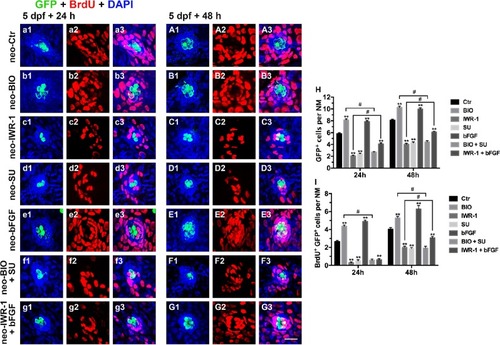
Effects of Wnt signaling on cell proliferation in the developing neuromast.

a1C3: Proliferative cells labeled with BrdU (red), SCs labeled with Sox2 (white), and HCs labeled with GFP (green). a1A3: Control neuromasts; b1B3: After addition of BIO; c1C3: After addition of IWR-1. d: Quantification of proliferative cells (BrdU+), SCs (Sox2+), and HCs (GFP+) shown in a1C3. e1F3 and h1I3: Proliferative cells labeled with BrdU (red), SCs labeled with Sox2 (white), and HCs labeled with myosin VI (green). e1E3: wt Apc larvae; f1F3: Apcmcr mutants showing elevated Wnt/β-catenin activity; h1H3: Heat shock-negative control larvae (HS-ctr); i1I3: Wnt repression by heat shock induction of the hs:dkk1 transgene (hs:dkk1). g, j: Quantification of the proliferative cells (BrdU+), SCs (Sox2+), and HCs (Myosin VI+) shown in e1F3 (g) and h1I3 (j). n = 5–7 fish per group. ** Indicates p < 0.001, and error bars indicate the standard error of the mean. K1O1 and K2–O2: WISH analysis of Sox2 (K1–O1) and atoh1a (K2–O2) expression in the neuromasts from different groups. Scale bar in I3= 20 μm for a1–C3, e1–F3, and h1–I3. Scale bar in O2 = 30 μm for K1O1, K2O2

Effects of the Wnt and FGF signaling pathways on proliferation and differentiation during initial neuromast development.

a1D3: Proliferative cells labeled with BrdU (red), SCs labeled with Sox2 (white), and HCs labeled with GFP (green). a1A3: Control neuromast; b1B3: After addition of BIO; c1C3: After addition of SU5402; d1D3: After 6 h of incubation with BIO, SU5402 and BIO were added for 18 h; e: Quantification of the proliferative cells (BrdU+), SCs (Sox2+), and HCs (GFP+) shown in a1D3. f1I3: Proliferative cells labeled with BrdU (red), SCs labeled with Sox2 (white), and HCs labeled with myosin VI (green). f1F3: wt Apc larvae; g1G3: Apcmcr mutants; h1H3: After addition of SU5402; i1I3: 54 hpf Apcmcr embryos were treated with SU5402 for 18 h. j: Quantification of the proliferative cells (BrdU+), SCs (Sox2+), and HCs (Myosin VI+) shown in f1I3. n = 5–7 fish per group. ** Indicates p < 0.001, # indicates p < 0.05, and error bars indicate the standard error of the mean. K1N1 and K2N2: WISH analysis of Sox2 (K1N1) and atoh1a (K2N2) expression in the neuromasts from different groups. Scale bar in I3 = 20 μm for a1D3 and f1I3. Scale bar in N2 = 30 μm for K1N1, K2N2

Effects of Wnt activation on cell proliferation and differentiation in FGF-inhibited larvae.

a1C3: Proliferative cells labeled with BrdU (red), SCs labeled with Sox2 (white), and HCs labeled with myosin VI (green). a1A3: Control neuromast; b1B3: After addition of SU5402; c1–C3: After 6 h of incubation with SU5402, BIO and SU5402 were added for 18 h; d: Quantification of the proliferative cells (BrdU+), SCs (Sox2+), and HCs (Myosin VI+) shown in a1C3. n = 5–7 fish per group. ** Indicates p < 0.001, and error bars indicate the standard error of the mean. Scale bar in C3 = 20 μm for a1C3

Effects of FGF activation on cell proliferation in Wnt-inhibited larvae.

a1D3: Proliferative cells labeled with BrdU (red), SCs labeled with Sox2 (white), and HCs labeled with GFP (green). a1–A3: Control neuromast; b1B3: After addition of IWR–1; c1C3: After addition of bFGF; d1D3: After 6 h of incubation with IWR–1, bFGF and IWR–1 were added for 18 h; e: Quantification of the proliferative cells (BrdU+), SCs (Sox2+), and HCs (GFP+) shown in a1D3. f1I3: Proliferative cells labeled with BrdU (red), SCs labeled with Sox2 (white), and HCs labeled with myosin VI (green). f1F3: Heat shock-negative control larvae (HS–ctr); g1G3: Wnt repression by heat shock induction of the hs:dkk1 transgene (hs:dkk1); h1–H3: After addition of bFGF; i1I3: At 54 hpf, hs:dkk1 embryos were treated with bFGF for 18 h. j: Quantification of the proliferative cells (BrdU+), SCs (Sox2+), and HCs (myosin VI+) shown in f1I3. n = 5–7 fish per group. ** Indicates p < 0.001, # indicates p < 0.05, and error bars indicate the standard error of the mean. K1N1 and K2N2: WISH analysis of Sox2 (K1N1) and atoh1a (K2N2) expression in the neuromasts from different groups. Scale bar in I3 = 20 μm for a1D3 and f1I3. Scale bar in N2 = 30 μm for K1N1, K2N2

Whole-mount in situ hybridization of <italic>p27</italic>, <italic>p21</italic>, and <italic>ccnd1</italic> following regulation of Wnt and FGF signaling.

A1G3 In situ hybridization of p27 (A1G1) p21 (A2G2) and ccnd1 (A3G3) following BIO (B1B3), IWR-1 (C1C3), SU5402 (D1D3), bFGF (E1E3), BIO+SU5402 (F1F3), and IWR-1+bFGF (G1G3) treatments. Scale bar in G3 = 30 μm for A1G3

Whole-mount in situ hybridization of several Wnt and FGF target genes following regulation of Wnt and FGF signaling.

In situ hybridization of ctnnb1 (A1G1), ctnnb2 (A2G2), tcf7l2 (A3G3), fgf3 (A4G4), fgf10 (A5G5), pea3 (A6G6), and fgfr1 (A7G7) following BIO (B1B7), IWR-1 (C1C7), SU5402 (D1D7), bFGF (E1E7), BIO+SU5402 (F1F7), and IWR-1+bFGF (G1–G7) treatments. Scale bar in G7 = 30 μm for A1G7

Effects of exogenous regulation of the Wnt and FGF pathways on regenerative proliferation at 24 hpa and 48 hpa after neomycin injury.

a1G3: Regenerating cells labeled with BrdU (red) and SCs labeled with Sox2 (white). a1a3: 24 hpa after neomycin damage; A1A3: 48 hpa after neomycin damage; b1b3: 24 hpa after addition of BIO, an activator of the Wnt pathway; B1B3: 48 hpa after addition of BIO; c1c3: 24 hpa after addition of IWR-1, an inhibitor of the Wnt pathway; C1–C3: 48 hpa after addition of IWR-1; d1d3: 24 hpa after addition of SU5402, an inhibitor of the FGF pathway; D1D3: 48 hpa after addition of SU5402; e1e3: 24 hpa after addition of bFGF, an activator of the FGF pathway; E1E3: 48 hpa after addition of bFGF; f1f3: 24 hpa after addition of BIO and SU5402; F1F3: 48 hpa after addition of BIO and SU5402; g1g3: 24 hpa after addition of IWR-1 and bFGF; G1G3: 48 hpa after addition of IWR-1 and bFGF. hj: Quantification of the supporting cells (Sox2+) (h), proliferative cells (BrdU+) (i) and regenerating supporting cells (BrdU+ Sox2+) (j) after blocking or enhancing the Wnt and FGF pathways. n = 7 fish per group. ** Indicates p < 0.001, # indicates p < 0.05, and error bars indicate the standard error of the mean. Scale bar in G3 = 20 μm for a1G3

Effects of exogenous regulation of the Wnt and FGF pathways on HC regeneration at 24 hpa and 48 hpa after neomycin injury.

a1G3: Regenerating cells labeled with BrdU (red) and HCs labeled with GFP (green). a1a3: 24 hpa after neomycin damage; A1A3: 48 hpa after neomycin damage; b1b3: 24 hpa after addition of BIO; B1B3: 48 hpa after addition of BIO; c1c3: 24 hpa after addition of IWR-1; C1–C3: 48 hpa after addition of IWR-1; d1d3: 24 hpa after addition of SU5402; D1D3: 48 hpa after addition of SU5402; e1e3: 24 hpa after addition of bFGF; E1E3: 48 hpa after addition of bFGF; f1f3: 24 hpa after addition of BIO+SU5402; F1F3: 48 hpa after addition of BIO + SU5402; g1g3: 24 hpa after addition of IWR-1 + bFGF; G1G3: 48 hpa after addition of IWR-1 + bFGF. h and i: Quantification of the HCs (GFP+) (h) and regenerating HCs (BrdU+ GFP+) (i) after blocking or activating the Wnt and FGF pathways. n = 7 fish per group. ** Indicates p < 0.001, # indicates p < 0.05, and error bars indicate the standard error of the mean. Scale bar in G3 = 20 μm for a1G3

Acknowledgments
This image is the copyrighted work of the attributed author or publisher, and ZFIN has permission only to display this image to its users. Additional permissions should be obtained from the applicable author or publisher of the image. Full text @ Exp. Mol. Med.