
- Title
-
The Effect of Fluence on Macrophage Kinetics, Oxidative Stress, and Wound Closure Using Real-Time In Vivo Imaging
- Authors
- Paredes, A.D., Benavidez, D., Cheng, J., Mangos, S., Patil, R., Donoghue, M., Benedetti, E., Bartholomew, A.
- Source
- Full text @ Photobiomodul Photomed Laser Surg

(A) and (B) display bright field image of fish after 60 min postinjury of a wounded untreated control and of a wounded and treated fish with 3 J/cm2, respectively. (C) and (D) display a color map of the ROS probe (DHE) intensity; red hue indicating saturated DHE and blue hue indicated absence of DHE. Fish of untreated wounds 0 J/cm2 (n = 21) were compared with laser-treated wounds: 3 J/cm2 (n = 11), 9 J/cm2 (n = 8), and 18 J/cm2 (n = 8). (E) displays group overall geometric mean ± 95% confidence intervals of DHE mean intensity values at 60 and 120 min postinjury. Student's t-tests (*p < 0.05), (**p < 0.01), (***p < 0.001) were performed in Microsoft Excel. DHE, dihydroethidium; ROS. |

Wound recruited macrophages of 0, 3, 9, 18 J/cm2 treatment groups of fish (n = 20, 12, 10, and 8, respectively) were tracked using software analysis. Representative control fish (A) and 3 J/cm2(B) are shown with trajectories with the highest total distances hued as dark red and lowest values hued as dark blue. Quantitative measures were algorithmically derived at T1 (30–60 min postinjury), T2 (30–90 min postinjury), and T2 (30–120 min postinjury) temporal domains postinjury with means and 95% CIs for each independent group measure. Macrophage measures of absolute velocity (C)meandering index (D) were determined to evaluate persistence. Wound-oriented net distance traveled (E) and static ratio (F)were determined to evaluate wound bias efficiency. Statistical differences were computed with Student's t-tests (*p < 0.05), (**p < 0.01) in Graphpad® Prism. |
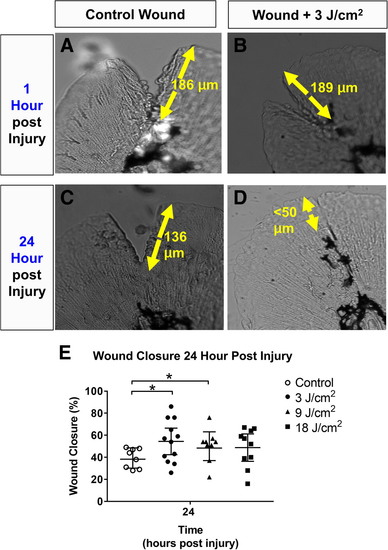
(A) and (B) show caudal fin wound region 1 h post wounding. (C) and (D) display the wound region 24 h post wounding, untreated and treated with (3 J/cm2) laser, respectively. (E) displays the geometric mean ± 95% confidence interval of percentage wound closure from 1 to 24 h postwound of untreated control group (n = 8) and 3, 9, and 18 J/cm2laser-treated groups (n = 12, 9, and 10, respectively). Student's t-tests (*p < 0.05) were performed in Microsoft Excel and wound measurements were performed in ImageJ. |