
- Title
-
Comparison the Effect of Ferutinin and 17β-Estradiol on Bone Mineralization of Developing Zebrafish (Danio rerio) Larvae
- Authors
- Zare Mirakabad, H., Farsi, M., Malekzadeh Shafaroudi, S., Bagheri, A., Iranshahi, M., Moshtaghi, N.
- Source
- Full text @ Int. J. Mol. Sci.
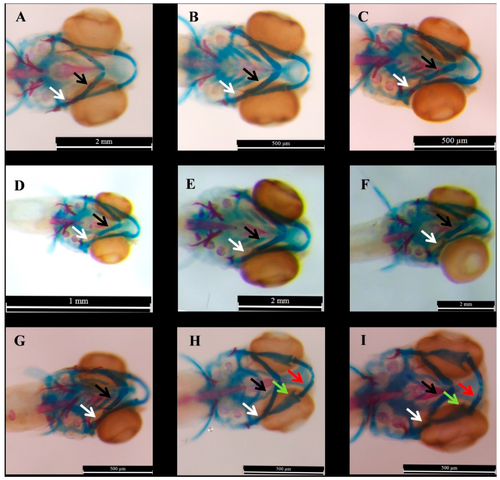
The samples of the morphological changes in the E2-treated zabrafish at 6 dpf which were treated with 2, 10 and 20 µM of E2 compared to DMSO (0.1%) at 1 dpf, 2 dpf, or 3 dpf. Scale bars represent 500 µM, 1 mm, and 2 mm. The blue parts represent ceratohyal and red parts demonstrate mineralized sections. (A–C) indicate the samples of the larvae which were treated with 2 µM of E2 at 1 dpf, 2 dpf, and 3 dpf, respectively, (D–F) Show the result of alcian blue-alizarin red staining larvae which were exposed to DMSO (0.1%) at 1 dpf, 2 dpf, and 3 dpf, respectively. (G–I) represent the larvae which were exposed to E2 at 3 dpf with 10, 20, and 20 µM. The arrows demonstrate some changes: white for hyomandibular, black for ceratohyal, green for palatoquadrate, and red arrows for Meckel. |

Two color staining and scoring system of the target bones in treated zebrafish larvae at 6 dpf. (A) Alcian-blue and alizarin-red staining steps, (B) sample of the stained ferutinin-treated larvae: blue parts represent ceratohyal and red parts demonstrate mineralized sections and the scale bar is 500 μM, and (C) ceratohyal and hyomandibular scoring system: 0 when the target area was just blue without bone mineralization, 1 for bone mineralization of one part of target cartilage, 2 for red stained two parts of cartilage but not completed, and 3 was for completely mineralized bone. Circles showed the position of the ceratohyal and hyomandibular as target bones. |