
- Title
-
ZF-Mapper: Simple and Complete Freeware for Fluorescence Quantification in Zebrafish Images
- Authors
- Yamamoto, D., Sato, D., Nakayama, H., Nakagawa, Y., Shimada, Y.
- Source
- Full text @ Zebrafish
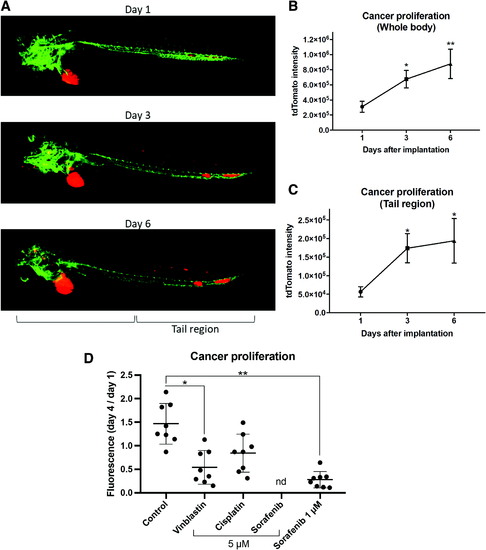
ZF-Mapper analysis for cancer xenograft zebrafish. (A) Typical images of tdTomato-labeled A375 xenograft zebrafish from day 1 to day 6 after cell implantation. (B) Whole-body tdTomato fluorescence as quantified using ZF-Mapper. (C) tdTomato fluorescence in the posterior half of zebrafish, that is, the tail region. n = 8, *p < 0.05, **p < 0.01 versus day 1. Error bars indicate standard error of the mean. (D) ZF-Mapper analysis for anticancer drug treatment of melanoma xenografts. Fluorescence intensities of the implanted A375-tdTomato were quantified using ZF-Mapper and calculated as the ratio for day 1/day 4 cell proliferation. n = 8, *p < 0.05, **p < 0.01 versus day 1. Error bars indicate standard deviation, and “nd” indicates no fish survived with 5 μM sorafenib. Color images are available online. |

Construction of a 3D fluorescence intensity model from the ZF-Mapper data. (A) Input image of macrophage-EGFP zebrafish (tg [mepg1:EGFP], 6 days postfertilization). (B) The ZF-Mapper output data were imported to the “rgl” package of R and a 3D scatter plot was created. (C) Tilted image of (B). An interactive 3D model can be downloaded as Supplementary Data. 3D, three-dimensional. Color images are available online. |