Rapid and efficient mutagenesis using CRISPR/Cas9 genome editing in zebrafish. (A) To generate a stable mutant line, F0 CRISPR/Cas9 injected individuals carrying mosaic mutations (defined by fin-clipping, B) should be outcrossed to wildtype fish to allow selection of a single germline mutation. Out-crossing the founder to wildtype will establish a stable F2 mutant line. Note that the F1 can have multiple founders with damaging mutations, incrossing these will result in F2 homozygotes (for recessive alleles) for functional analysis. When performing incrosses from F2, it will take another 2 months of breeding time. (B) This rapid protocol can be used to generate mutations in a gene of interest using CRISPR/Cas9 RNA or protein with gRNAs targeted against the gene from custom made gRNA oligos (i). Micro-injection of CRISPR/Cas9 RNA or protein and gRNAs specific to gene of interest into embryos at the single cell stage (ii) generating double stranded breaks during the first few rounds of cell divisions. The repair machinery is prone to errors and those cells will carry a different type of mutation giving a range of insertion and deletion (indel) mutations (spectrum of mutations, mosaicism). The overall mutagenic efficiency is typically high (around 80% with fragment analysis) allowing larval skeletal phenotypes to be assessed in the injected (F0) population (60). After imaging an Alizarin Red S (AR) stained individual in a transgenic background (here osteoblast marker sp7:gfp)(iii), mutagenesis assessment such as fragment analysis will determine a quantified mutagenesis rate (61) which can be correlated to a phenotype (iv). Note that mosaic mutants (crispants) can also be grown up to see the effect on the adult skeleton.

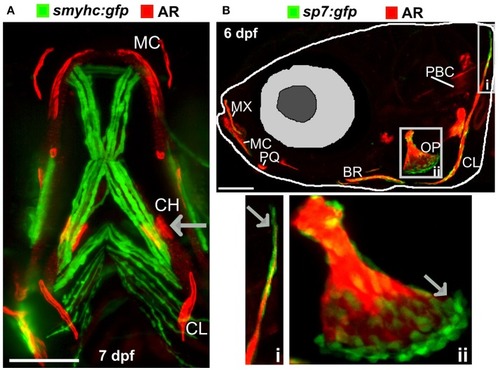
Ossified elements in the cranial region during early development. (A) Ventral view of a 7 days live Alizarin Red S (AR) labeled larval jaw showing dermal ossification of cleithrum (CL), and ossification of the cartilaginous ceratohyal (CH). Arrow indicates the CH which undergoes endochondral ossification. Slow muscle transgene reporter in green (smych:gfp). Image taken on a Leica lightsheet microscope. (B) Lateral view of a 6 days old larva live labeled with Alizarin Red S (red) and carrying GFP under the control of the osteoblast promoter s7/osterix (green; sp7:gfp) allowing visualization of mineralized elements (red) and osteoblasts (green) in a living individual. Insets show the cleithrum (i) and operculum (ii) with osteoblast enrichment at the distal ends of these elements (gray arrows). Image taken on a confocal microscope. Wildtype strains AB/TL in both panels. Ossified elements: BR, branchiostegal ray; CH, ceratohyal; CL, cleithrum; MC, Meckel's cartilage; MX, maxilla; OP, operculum; PBC, posterior basicranial commissure; PQ, palatoquadrate. Scale bars = 100 μm.

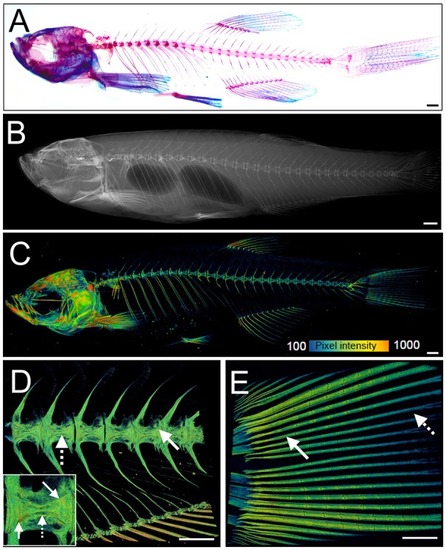
Examples of visualization and quantification of mineralized bone in zebrafish. (A) Wholemount Alizarin Red S (AR) and Alcian Blue staining of 3 months fixed fish. (B) Radiograph of 1-year old live fish showing whole body: endo- and exoskeleton. (C) Low resolution μCT images acquired with a 20 μm voxel size of a 3 months old fish. Note that pixel intensity can be used to determine BMD; represented on the color coded pixel intensity bar. (D,E) High resolution (5 μm voxel size) μCT images of vertebral column with anal fin rays (D) and caudal fin rays (E). Vertebral centrae have higher density at their edges (solid arrow) than the center (dashed arrow). In the fin rays, a higher density (solid arrow) is observed in older segments within the proximity to the body in comparison to younger segments located more caudally showing lower pixel intensity (dashed arrow). The same pixel intensity color coding as (C) applies. All fish and their insets are depicted from a lateral view in an anterior-posterior (left-right) orientation. Scale bars = 50 μm in (A,B); and 100 μm in (C–E).

Fin regeneration and fracture assay to visualize and quantify live bone formation and repair. (A) Schematic representation of a zebrafish with a standard fluorescent stereomicroscope image of a live Alizarin red S (AR) pre-amputation caudal fin (inset). (B) Schematic representation of bone regeneration after fin amputation showing the (simplified) cascade of events that follow after fin amputation to regenerate bone (a single ray depicted here). This allows studying de novo bone formation by newly formed osteoblasts (orange cells) and differentiated osteoblasts (green cells) and subsequent remodeling by osteoblasts and osteoclasts (purple cells) in an adult fish. Note that during osteogenesis that there is a gradient of mineralization. (C) Live images of the tail fin labeled with Alizarin red (red) prior to amputation (i, ii) and Calcein (green) post-amputation (iii, iv) taken on a fluorescent dissecting microscope. All images in panel come from the same fish. Seven days post-amputation showing regrowth of new bone (green). Note that intense Calcein staining is visible distally from the amputation site (white dotted line). (D) The fracture healing assay involves applying pressure on a fin ray bone element to induce a small fracture to one segment of the fin ray (i), which is visible with life AR staining (ii). Green Calcein labels the new bone formed in the fracture callus by 7 days (iii and iv). The white arrow indicates the fracture site. Scale bars = 500 μm, 3 months old wildtype TL/EKK females.

Zebrafish elasmoid scale structure and bone cell types. (A) Single scale from the flank of a 3 months old fish carrying the sp7:gfp osteoblast reporter transgene (green) and stained for Alizarin Red S (AR, red). Whole scale is shown in bright field (i) and gray scale images for AR (ii) and GFP (iii) in the top panels. The brightfield image (i) depicts the anterior anchor region (A, black dotted line boundaries), the lateral circuli (L, green dotted line boundaries, white arrow), central region (C, surrounded by black, green, and light blue dotted lines), and central region covered by epidermis (C+E, light blue dotted line, with grooves by green arrow) with enhanced mineralization. (B) Confocal images showing a merge image of osteoblasts (sp7:gfp transgenic fish, green) abundantly distributed over the freshly harvested scale and AR staining (red). Individual channels are depicted in gray scale images. Note increased mineralization at the edge of the scale corresponding increased GFP presence (blue arrows). Insets focus on the lateral circulus and note osteoblast cytoplasmic protrusions (pink arrows). (C) Confocal images visualizing osteoclasts with cathepsin K (ctsk) YFP reporter expression (green), mineralization by AR (red), and brightfield (gray). Note that YFP positive cells were predominantly seen in the central region with epidermis (C+E) and distal edges of the central region (C). (D) Multiphoton forward scattering (second harmonic generation (SHG), 880 nm wavelength) visualizes collagen fibrils in an ethanol fixed scale. Inset (i) shows the organization of collagen fibrils in a plywood structure. Wildtype strains (panel): TL/EKK (A), TL (B), AB/TL (C). Scale bars 100 μm.

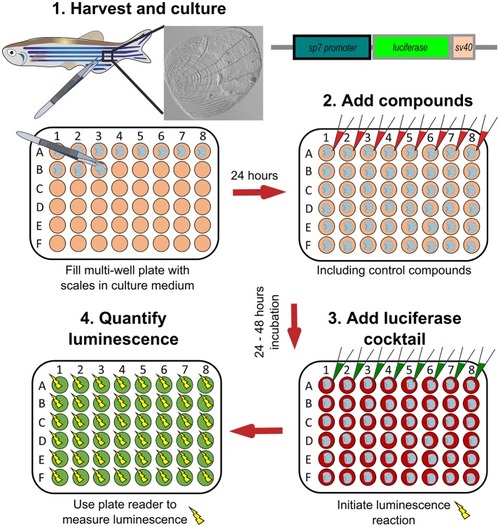
Schematic representation to show how osteoblast activity can be quantified from scales. Scales from sp7:luciferase transgenic reporter fish are harvested from the lateral flanks of a fish, then cultured in multi-well plates with DMEM culture medium (orange wells) at 28°C for 24 h. Compounds of interest can then be added (red wells) to the scales and incubated prior addition of a luciferin cocktail (green wells) and measurement of luciferase activity with a luminescent (yellow sparks) plate reader. Based on text from de Vrieze et al. (38).

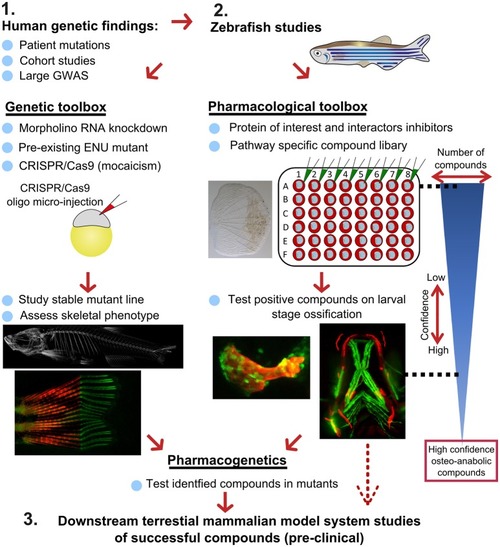
Proposed pipeline using zebrafish as a primary testing platform to address bottleneck for fast and affordable translation of human genetic findings. Two experimental arms using the genetic and pharmacological toolboxes allow simultaneous drug target validation. The blue reversed triangle depicts the reduction in number of putative osteo-anabolic compounds (along with an increase in confidence) when testing the compounds using the skeletal assays available.

Acknowledgments
This image is the copyrighted work of the attributed author or publisher, and ZFIN has permission only to display this image to its users. Additional permissions should be obtained from the applicable author or publisher of the image. Full text @ Front Endocrinol (Lausanne)