
- Title
-
tp53 deficiency causes a wide tumor spectrum and increases embryonal rhabdomyosarcoma metastasis in zebrafish.
- Authors
- Ignatius, M.S., Hayes, M.N., Moore, F.E., Tang, Q., Garcia, S.P., Blackburn, P.R., Baxi, K., Wang, L., Jin, A., Ramakrishnan, A., Reeder, S., Chen, Y., Nielsen, G.P., Chen, E.Y., Hasserjian, R.P., Tirode, F., Ekker, S.C., Langenau, D.M.
- Source
- Full text @ Elife
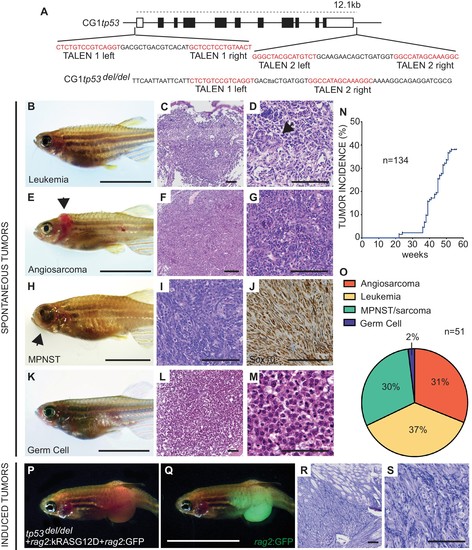
Homozygous tp53del/del zebrafish spontaneously develop a wide range of tumor types. (A) tp53 genomic locus and CG1 tp53del/del allele. TALEN arms were designed to target the 5’ and 3’ genomic sequence of tp53 (red). (B–M) CG1 tp53del/del zebrafish develop leukemia (B–D), angiosarcoma (E–G), MPNSTs (H–J), and germ cell tumors (K–M). Whole animal images (B,E,H,K), hematoxylin/eosin (H and E) stained sections (C,D,F,G,I,L,M), and immunohistochemistry for Sox10 (J). Blast-like leukemia cells predominate in the kidney marrow and efface the renal tubules (black arrow, (D). (N) Tumor incidence in CG1 tp53del/del zebrafish (n = 134). (O) Quantitation of tumor types that form in CG1 tp53del/del mutant zebrafish by 55 weeks of life based on histology review (n = 51). (P–S) kRASG12D-induced embryonal rhabdomyosarcoma (ERMS) generated in CG1 tp53del/del zebrafish. Whole animal bright field and GFP-epifluorescence overlap images (P and Q, respectively). H and E stained sections revealed features consistent with human ERMS (R,S). Scale bars equal 12.5 mm in whole animal images and 100 μm in histology images. PHENOTYPE:
|
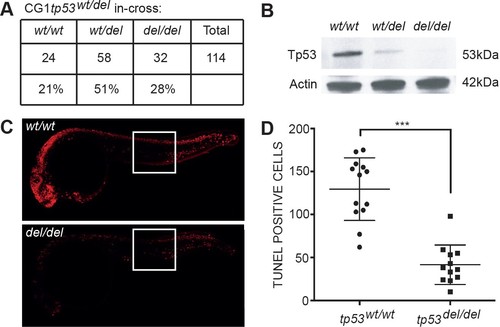
tp53del/del zebrafish survive at expected Mendelian ratios, lack Tp53 protein expression, and are resistant to irradiation-induced cell death. (A) Survival of animals by genotype from a heterozygous tp53wt/del in-cross. tp53 homozygous wild-type (wt/wt), heterozygous (wt/del), and homozygous (del/del) mutant fish. (B) Western blot analysis at 24 hr post-fertilization (hpf) whole embryos. Actin is used as a loading control. (C–D) TUNEL staining performed on tp53wt/wt and tp53del/del embryos following gamma-irradiation at 24hpf (16 Gray) and fixation at 30hpf. Whole embryos images are shown for representative animals of each genotype (C). Quantification of TUNEL-positive cells within 1000 micron2 area. Regions where cells were counted are outlined by the white boxes in panel C. p<0.001 by Student’s T-test. |
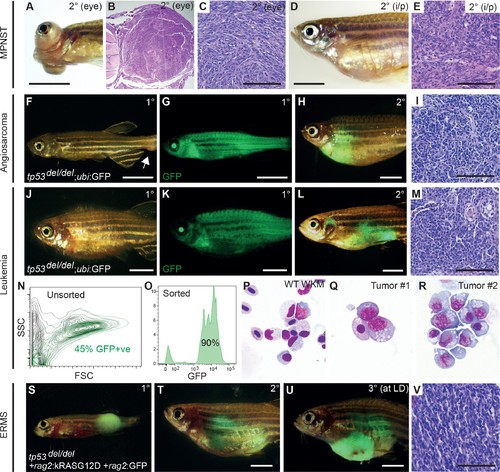
tp53del/del tumors efficiently transplant into syngeneic CG1 strain zebrafish. (A–E) A primary tp53del/del MPNSTs that formed in the eye transplanted orthotopically into the periocular space (A–C) or into the peritoneum of CG1-strain recipient fish (D–E). Intraperitoneal injection (i/p). (F–I) tp53del/del Tg(ubi:GFP)-positive angiosarcoma. Primary tumor-bearing fish (F–G) and transplanted animal (H–I). (J–R) tp53del/del Tg(ubi:GFP)-positive leukemia. Primary leukemia (J–K) and transplanted leukemia shown at 20 days post-transplantation (L–R). Whole kidney marrow was isolated from leukemia-engrafted fish and analyzed by FACS (N–O). (N) Forward and side scatter plot of whole kidney marrow of unlabeled CG1 host animal to assess ubi:GFP-positive tp53del/del leukemia cells following transplantation. (O) Analysis of GFP+ ubi:GFP-positive tp53del/del leukemia cells following FACS. Purity was ≥90%. (P–R) Cytospins and Wright/Giemsa staining of whole kidney marrow cells isolated from wildtype fish (P) compared with FACS sorted GFP+ cells from two representative aggressive NK cell-like leukemias, showing large blastic cells with abundant basophilic, vacuolated cytoplasm (Q–R). (S–V) Embryonal rhabdomyosarcoma arising in tp53del/del fish micro-injected at the one-cell stage with linearized rag2:kRASG12D + rag2:GFP. Primary (S), transplanted (2°) (T), and serially transplanted ERMS (3°) (U,V). Whole animal bright-field images (A,D,F,J) and merged GFP-fluorescence images (G,H,K,L,S–U). Hematoxylin and eosin stained sections of engrafted tumors (B–C,E, I, M,V). Scale bars are 5 mm in whole animal images and 100 μm for histology images. |

tp53del/del kRASG12D-induced ERMS have increased invasion and metastasis. (A–F) Whole animal fluorescent images of CG1-strain fish engrafted into the dorsolateral musculature with non-disseminated (A–C) and disseminated ERMS (D–F). Days post transplantation (dpt). White lines demarcate GFP+ tumor area. White arrowheads show site of injection and yellow arrowheads denote metastatic lesions. (G) H and E and (H) GFP immunohistological staining of fish engrafted with metastatic tp53del/del kRASG12D-induced ERMS. (I) Quantification of growth confined to site of injection (green bars) and compared with animals that exhibited local invasion or metastatic ERMS following tumor engraftment until fish were moribund. X-axis identifies 5 tp53wt/wt and 11 tp53del/del ERMS primary tumors that were transplanted into wild-type CG1 syngeneic host zebrafish. p=0.003, one-sided Fisher’s exact test. Scale bars denote 5 mm. |