
- Title
-
Conditional control of fluorescent protein degradation by an auxin-dependent nanobody
- Authors
- Daniel, K., Icha, J., Horenburg, C., Müller, D., Norden, C., Mansfeld, J.
- Source
- Full text @ Nat. Commun.
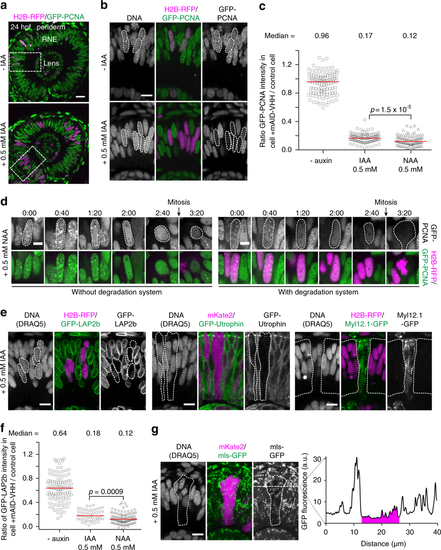
Auxin-dependent degradation of GFP-tagged proteins by mAID-nanobodies in zebrafish. a Eye of a 24 hpf zebrafish embryo in Tg(bactin:GFP-PCNA) mosaically injected with RNAs of TIR1, mAID-nanobody and H2B-RFP RNA to visualize affected cells. The dashed box shows the area displayed in b. RNE, retinal neuroepithelium. Scale bar: 20 μm. b GFP-PCNA degradation in the presence of IAA. Dashed line: Nuclei of cells expressing the degradation system. Scale bar: 10 μm. c Comparison of GFP-PCNA degradation at 22 hpf in response to IAA and NAA treatment. 1 represents no degradation and 0 represents complete degradation. Bars represent median, −auxin control (n = 11, 110 cells), IAA (n = 11, 108 cells), NAA (n = 11, 108 cells). Significance according to a two-tailed Mann–Whitney test. d Time-lapse imaging of GFP-PCNA degradation in response to NAA in cells without (H2B-RFP negative, left panel) and with degradation system (H2B-RFP positive, right panel). Scale bar: 5 μm. e Degradation of GFP-fusion proteins localized to different cellular structures. Nuclear membrane-localized Lamina-associated polypeptide 2 Tg(bactin:GFP-LAP2b), filamentous actin binding Utrophin fragment Tg(bactin:GFP-Utrophin) and actomyosin-associated non-muscle myosin II light chain Tg(bactin:Myl12.1-GFP). Cells containing the degradation system were visualized by cytoplasmic H2B-RFP or cytoplasmic mKate2 RNA co-injection. Scale bar: 10 μm. f Comparison of GFP-LAP2b degradation in response to IAA and NAA treatment as in c. Bars represent median, −auxin control (n = 11, 110 cells), IAA (n = 5, 50 cells), NAA (n = 11, 111 cells). Significance according to a two-tailed Mann–Whitney test. g Depletion of GFP from mitochondria, Tg(Eef1a1:mls-GFP). Cells containing the degradation system show cytoplasmic mKate2 signal. GFP intensity profile along dashed line is plotted, magenta corresponds to the degradation area. Scale bar: 10 μm. All data shown in this figure are representative examples from at least two independent biological experiments |

Auxin tolerance and GFP-PCNA degradation in zebrafish. (a) Bright field images of zebrafish embryos grown in the presence of the indicated concentration of IAA until 48 hpf. Scale bar: 1 mm. (b) Time-lapse imaging of GFP-PCNA degradation in response to 0.5 mM NAA as shown in Fig. 6d. Cells with degradation system are H2B-RFP positive. Scale bar: 5 μm. |