
- Title
-
Noise in the Vertebrate Segmentation Clock Is Boosted by Time Delays but Tamed by Notch Signaling
- Authors
- Keskin, S., Devakanmalai, G.S., Kwon, S.B., Vu, H.T., Hong, Q., Lee, Y.Y., Soltani, M., Singh, A., Ay, A., Özbudak, E.M.
- Source
- Full text @ Cell Rep.
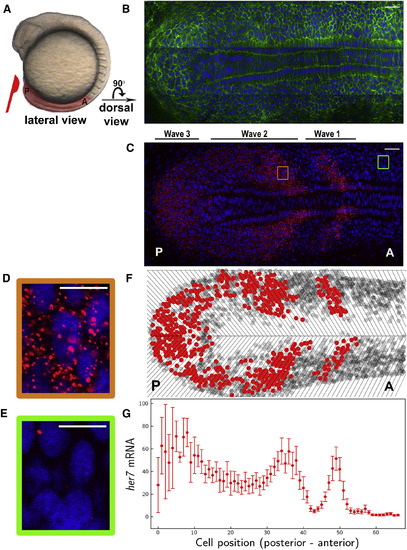
Single RNA Molecules Are Counted in Single-Phase-Binned Cells in the Intact Zebrafish Presomitic Mesoderm (A) A wild-type zebrafish embryo at the 10-somite stage. PSM, highlighted in pink, is dissected from the embryo. Posterior (P) is to the left, and anterior (A) is to the right. (B and C) A single z-section of a smFISH picture in a flat-mounted PSM from a wild-type embryo. Cell membrane (green in B), her7 mRNA (red in C) and nuclear staining (blue in B and C). PSM images are rotated 90 degree compared to that in (A). (D and E) The images are zoomed on a high-expression stripe (orange square) (D) or a low-expression stripe (green square) (E). (F) Tissue is divided in single-cell-wide disks along the axis corresponding to different oscillation phases. Cells containing RNA higher or lower than an arbitrary threshold are plotted as red or gray circles, respectively. Top is left half of PSM, and bottom is right half of PSM. (G) RNA levels from left half of PSM are plotted along the posterior-to-anterior direction. Each dot corresponds to the average RNA number in a spatial phase-binned cell population; error bars indicate 2 SEs. Scale bars mark 30 and 10 μm in (B) and (C) and in (D) and (E), respectively. See also Figure S1 and Table S1. |
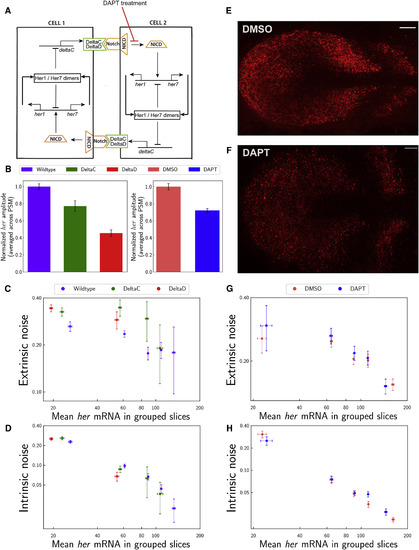
Notch Signaling Tames Extrinsic Noise (A) Cartoon model for Notch-mediated cell-to-cell coupling. Her dimers repress transcription of her-family genes and deltaC. DeltaC (and DeltaD) are membrane-bound ligands (green) that bind and activate Notch (orange) receptor in neighboring cells. Intracellular cleaved domain of Notch (NICD) activates transcriptions of her-family genes. (B) Total RNA amplitudes decreased in deltaC−/− (green) and deltaD−/− (red) mutants compared to wild-type embryos (purple) and in DAPT-treated embryos (blue) compared to DMSO-treated control embryos (pink) (p < 0.001). (C and D) Extrinsic noise (C) increased in deltaC−/− (green) and deltaD−/− (red) mutants compared to wild-type embryos (purple) (p < 0.001 in both lower and higher groups). Intrinsic noise levels (D) are shown in deltaC−/− (green) and deltaD−/− (red) mutants and wild-type embryos (purple). x axis is mean levels of total her (her1 + her7) RNA in grouped slices. Clock transcription decreased in notch mutants. Therefore, slices could only be grouped for the lower expression bins compared to wild-type data. (E and F) A single z-section of a smFISH picture for her7 mRNA (red) in DMSO-treated embryos (as a control, E) and DAPT-treated embryos (F). The stripy expression pattern of her7 mRNA is not disrupted after 1.5 hr DAPT treatment (F). Scale bars mark 30 μm. (G and H) Extrinsic (G) and intrinsic (H) noise levels in DAPT-treated embryos (blue) and DMSO-treated control embryos (pink). Error bars indicate 2 SEs. See also Figure S3. |

Representative z-sections of an smFISH image and the gradual change in the angle of clock expression stripes, related to Figure 1 (A-E) Different z-sections of an smFISH image show the cell membrane (green), nuclear (DAPI) and merge images in a wild-type embryo, respectively. Images belong to sections 25, 35, 45, 55 and 65 in z-axis, respectively. (F) Total her (her1+her7) RNA in each cell and the position of each cell are plotted for all cells from all wild-type embryos. Tissue sections further away from the microscopy objective have higher z-values. Successful detection of RNAs does not systematically depend on z-position in microscopy images. The data is first grouped according to z-position with 2μm bin size. Then, a moving average is calculated by using 3 bins. The centered moving average is plotted in the graph. (G) The angle between the clock expression stripes and the AP axis increases incrementally in the posterioanterior direction (away from the tail end of the embryos). The angle data from wild-type embryos is shown here. A linear function (𝑦 = 0.039 ∗ x + 44.23) fits to the data (R2 = 0.14). |