
- Title
-
Evidence for Myelin Sheath Remodeling in the CNS Revealed by In Vivo Imaging
- Authors
- Auer, F., Vagionitis, S., Czopka, T.
- Source
- Full text @ Curr. Biol.

Variability of Myelin Sheath Length along and across Axons (A) Confocal image of a spinal cord neuron expressing cntn1b:mCherry and cntn1b:Nfasca-EYFP at 7 days post-fertilization (dpf). Scale bar, 100 μm. (B) Confocal image of a spinal cord neuron expressing cntn1b:mCherry and cntn1b:Nfasca-EYFP in Tg(mbp:memCerulean) transgenic animals at 7 dpf. Scale bar, 10 μm. (C) Quantification of myelin sheath length (determined by internodal distance) along 12 axons at 7–8 dpf. Axons #1–10 were located in the middle/dorsal tracts of the spinal cord, #11, 12 in the ventral tract (Tukey’s multiple comparison test, ANOVA summary: p < 0.001, F(14,128) = 3,986). (D and E) Confocal image (top) and timeline of reconstructions of confocal stacks (bottom three) of a partially myelinated cntn1b:EGFP-expressing axon in Tg(mbp:tagRFPt-CAAX), Tg(mbp:KR) transgenic animals showing increasing (D) and stable myelination (E) from 6 to 15 dpf. Scale bar, 10 μm. (F and F′) Quantification of myelin sheath number along individual axon stretches (F) and the percentage of myelin coverage of this stretch (F′). Examples shown in (D) and (E) are colored blue and red, respectively. (G) Quantification of myelin sheath lengths along 10 partially myelinated axons at 7–8 dpf. See also Figure S1. |

Differences in Myelin Sheath Lengths Are Established within a Few Days after Their Initiation (A) Timeline of confocal images of an olig1:memEYFP-labeled myelin sheath in a Tg(mbp:memCerulean) background between 5 and 12 days post-fertilization (dpf) getting flanked by two neighboring sheaths over the course of analysis (arrowheads). Scale bar, 10 μm. (B) Timeline of confocal images as in A showing an individual sheath flanked by only one neighbor (arrowheads). Scale bar, 10 μm. (C) Quantification of the length of five example sheaths between 5 and 14 dpf. (D) Quantification of growth speeds of individual sheaths between 1 and 10 days post-initiation (dpi). Data are expressed as median with interquartile range (Wilcoxon matched-pairs signed-rank test, p < 0.001). (E) Quantification of the relative length increase of sheaths with two, one, or no neighboring sheath by the end of analysis. Data are expressed as mean ± SD. (F) Quantification of the relative length increase of sheaths initiated at 5 and 14 dpf, respectively. Data are expressed as mean ± SD. (G) Correlation of sheath growth speed from 1 to 3 dpi with its length at 8 dpi. See also Figure S2 and Movies S1 and S2. |
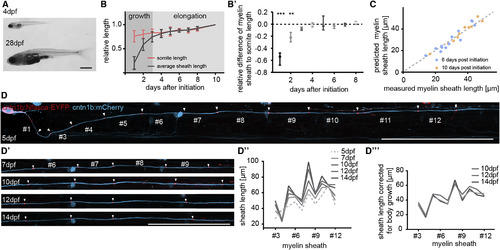
Long-Term Extension of Myelin Sheaths Compensates for Body Growth (A) Photographs of zebrafish at 4 and at 28 days post-fertilization (dpf). Scale bar, 1 mm. (B) Quantification of the relative increase of sheath length from their respective initiation onward compared to the increase in somite length over the same time. Data are expressed as mean ± SD. (B′) Quantification shown in (B) corrected for increase in body growth. Data are expressed as median with interquartile range (Wilcoxon signed-rank test). (C) Correlation between measured sheath length and their predicted length using increase in somite size as a reference. (D–D′′′) Timeline of confocal images of an individual cntn1b:mCherry, cntn1b:NFacsa-EYFP co-expressing neuron in the zebrafish spinal cord between 5 and 14 dpf. Scale bar, 100 μm (D and D′). (D″) Quantification of sheath lengths along the axon shown in (D) between 5 and 14 dpf. (D′′′) Quantification shown in (D″) corrected for animal body growth. See also Figure S2 and Movie S2. |

Evidence for Control of Myelin Sheath Length and Positioning by Axons (A) Timeline of confocal images of an olig1:memEYFP-labeled oligodendrocyte in a transgenic Tg(mbp:memCerulean) zebrafish between 5 and 7 days post-fertilization (dpf). Scale bar, 10 μm. Arrowheads depict the feeding process and the ends of the respective sheath. (B) Quantification of the position of the oligodendrocyte process relative to its sheath length. −1 and +1 refer to the anterior and posterior end of the sheath, respectively. (C) Confocal images of cntn1b:mCherry, cntn1b:NFasca-EYFP-expressing myelinated axons with (top) and without (bottom) collateral branches at the node of Ranvier. Scale bar, 10 μm. (D) Quantification of NFasca-EYFP-labeled nodes of Ranvier with and without collateral axon branches. See also Movie S1. |
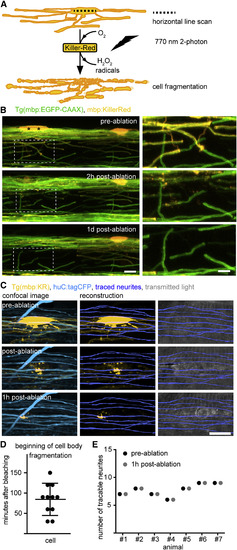
Targeted Ablation of Individual Oligodendrocytes without Causing Bystander Axon Damage (A) Schematic drawing of single oligodendrocyte ablation using two-photon bleaching of mbp:KillerRed-labeled cells. (B) Timeline of confocal images of individual mbp:KillerRed-expressing oligodendrocytes in Tg(mbp:EGFP-CAAX) full transgenic zebrafish at 7 days post-fertilization (dpf) before and after two-photon bleaching of the cells marked by the asterisk. Scale bars, 10 μm (left), 5 μm (right). (C) Confocal images and axon reconstructions of huC:tagCFP-labeled axons in Tg(mbp:KillerRed) zebrafish before and after oligodendrocyte ablation at 4 dpf. Scale bar, 10 μm. (D) Quantification of the beginning of cell body disintegration after two-photon bleaching of mbp:KillerRed-expressing cells at 4 dpf. Data are expressed and mean ± SD. (E) Quantification of traced neurites in direct proximity to the ablation site before and after oligodendrocyte ablation as shown in (C). See also Figure S3 and Movie S3. |
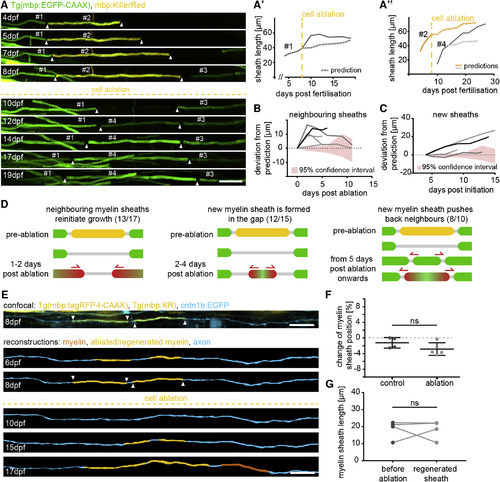
Myelin Sheaths Dynamically Remodel after Targeted Oligodendrocyte Ablation (A–A″) Timeline of confocal images of the formation of three consecutive sheaths, ablation, and subsequent remodeling between 4 and 19 days post-fertilization (dpf). (A′) shows the quantification of growth curves of sheath #1 over the time of analysis and its predicted growth (dotted line) based on its age and animal body growth. (A″) shows the quantifications of the measured sheaths #2 and #4 as seen in (A), and the respective predicted growth (dotted lines) described in (A′). Scale bar, 10 μm. (B) Quantification of deviated growth of individual sheaths neighboring the ablation site. (C) Quantification-deviated growth of new sheaths formed in the ablation site. (D) Schematic summarizing the frequency of observed/possibly observable events of sheath growth and remodeling. (E) Top: confocal image of discontinuously myelinated axons labeled with cntn1b:EGFP in a Tg(mbp:KR), Tg(mbp:tagRFPt-CAAX) transgenic animal at 8 dpf. Below: reconstructions of the same axon shown above at different time points before and after oligodendrocyte ablation between 6 and 17 dpf. Scale bar, 10 μm. (F) Quantification of the relative position of regenerated sheaths and the relative position of control sheaths along discontinuously myelinated axons over the same time. Data are expressed as mean ± SD (t test, t(7) = 1.598, p = 0.15). (G) Quantification of sheath length before and after ablation along discontinuously myelinated axons (t test, t(3) = 0.0592, p = 0.96). See also Movies S4, S5, and S6. |

Variability of sheath length, axon diameter of axons analysed, and validation of markers used. Related to Figure 1. A) Confocal image of an individual mbp:tagRFPt-CAAX myelinating oligodendrocyte in the spinal cord of Tg(mbp:EGFP-CAAX) full transgenic zebrafish at 7dpf. Scale bar: 10μm. B) Quantification of the length of randomly chosen myelin sheaths in Tg(mbp:EGFP-CAAX) at 7dpf, and the lengths of myelin sheaths formed by three different individual oligodendrocytes. C) Confocal images of a spinal cord axon expressing cntn1b:mCherry and cntn1b:Nfasca-EYFP in Tg(mbp:memCerulean) full transgenic animals at 4dpf and 6dpf. Nfasca-EYFP only localises to axonal areas that are not covered with myelin and is diffusely expressed along longer non-myelinated axon stretches (arrowheads). Scale bar: 10μm. D) Quantification of average sheath length along an individual axon relative to the diameter of the axon. E) Confocal images of Tg(mbp:EGFP-CAAX) full transgenic zebrafish, individual cntn1b:mCherry labelled axons, and Spectral Confocal Reflectance (SCoRe) as label-free method to visualise myelinated axons. Scale bars: 10μm. |
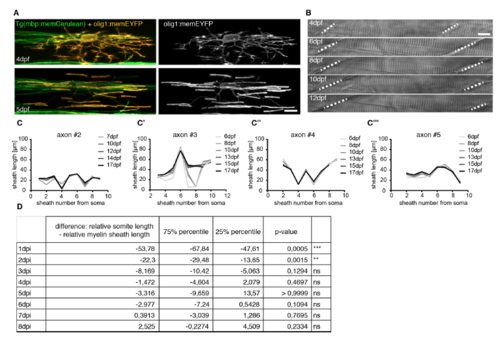
Characterisation of reporter constructs, animal growth, and additional information on axon myelination patterns over time. Related to Figures 2 and 3. A) Confocal images of an individual olig1:memEYFP oligodendrocyte in Tg(mbp:memCerulean) full transgenic animals at the onset of myelin sheath formation (top) and one day later (bottom). Scale bar: 10μm. B) Transmitted light images of an individual zebrafish between 4 and 12 dpf. Dashed lines indicate boundaries between two somites. Scale bar: 10μm. C-C’’’) Quantification of body growth corrected myelin sheath distribution along 4 individual axons between 6 and 17dpf. D) Quantification of the relative difference between somite and internode length at different time points after sheath initiation. Expression of data and significances are given in Fig. 2B’. |

Characterisation of oligodendrocyte ablation. Related to Figure 5. A) Time series of confocal images of mbp:KillerRed expressing cells in Tg(mbp:EGFP-CAAX) transgenic zebrafish at 7dpf before and at various time points after 2-photon bleaching of KillerRed-expressing cells. A’ and A’’ are zoom ins as indicated by the dashed boxes in A. Scale bar: 10μm. See also movie S1. B) Axon reconstructions of huC:tagCFP labelled axons in Tg(mbp:KillerRed) zebrafish before and after oligodendrocyte ablation at 4dpf using vertical line scan as negative control as shown in the cartoon below. A transected axon is shown by the red trace. Bottom: Confocal images of the areas shown by the dashed box highlight the transected axon. Scale bar: 10μm. |

Timelines of myelin sheath growth to identify neighbouring sheaths from confocal zstacks in the spinal cord of mbp transgenic zebrafish. Related to STAR Methods. A) Nearby myelin sheaths (arrowheads) are shown that do not oppose another over time in the x/y axis to form a nodal gap, and which must therefore locate on different axons. A’) Nearby myelin sheaths similar to A, but which do oppose another over time in the x/y axis to form a nodal gap, and which are therefore considered to locate on the same axon. Scale bar: 10 μm B) Maximum intensity projection and single planes of a confocal z-stack of the myelin sheaths shown in Figure 6A. Arrowheads depict nearby sheath when they are in the same focal plane. |