
- Title
-
Dietary Safety Assessment of Flk1-Transgenic Fish
- Authors
- Wei, Y., Huang, L., Cao, J., Wang, C., Yan, J.
- Source
- Full text @ Front. Physiol.
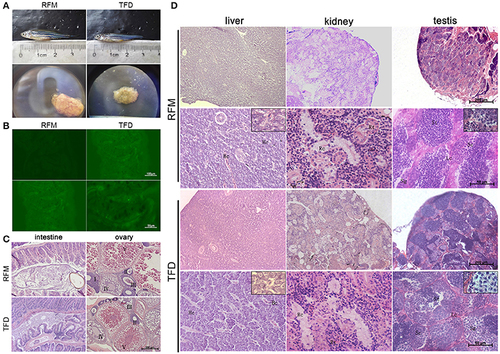
The comparisons of different characteristics between the TFD and control RFM group. (A) The adult fish of two groups had similar body length. The gonad size of TFD fish was smaller than to the control one. (B) The intestine cells of two groups didn't express GFP. Scale bars, 100 and 50 μm. (C,D) Histological analyses of the intestine, liver, kidney, ovary, and testis between the TFD and RFM group. I-V mean the 5 phases of oocytes, respectively. Hc, Hepatic cell; Bc, Blood capillary; Rt, Renal tubular; Rc, Renal capsule; Sg, Spermatogonia; Sc, Spermatocyte; St, Spermatid; Lc, Leydig cell; Scale bars, 200 and 50 μm. |
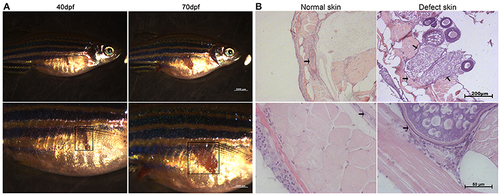
A skin developmental defect of the female F1 generation of TFD zebrafish. (A) The phenotypes of the F1 generation showed different sizes developmental defect. Scale bars, 2,000 and 1,000 μm. Black boxes represent the region of defect skin. (B) The normal and defect skin from the same F1 TFD fish. The patch and defect tissue adherent to the ovary were marked by square or arrows. Scale bars, 200 and 50 μm. |

Autofluorescence of the ovarian HE stained sections in bright and fluorescent fields. White arrows represent the strengthen autofluorescence patterns in the follicle walls. Scale bars, 40 μm. |