
- Title
-
Collective Cell Migration in Embryogenesis Follows the Laws of Wetting
- Authors
- Wallmeyer, B., Trinschek, S., Yigit, S., Thiele, U., Betz, T.
- Source
- Full text @ Biophys. J.
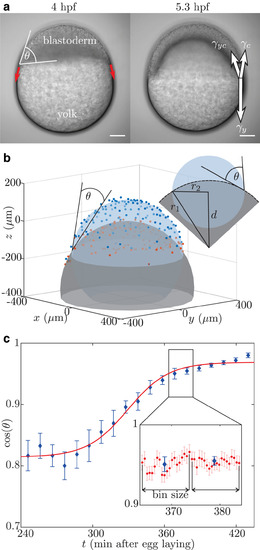
The contact angle is measured over time. (a) Beginning at 4 hpf (left), the cells forming the blastoderm move from the animal pole toward the vegetal pole of the yolk (red arrows). During this process, there are three different materials—yolk, cells, and medium—in contact, leading to interfaces carrying tension (right, white arrows). Scale bars, 100 μm. (b) The nuclei defining the yolk-blastoderm (red) and the nuclei defining the cells-medium (blue) interfaces are extracted from detected spots by filtering for nuclei close and away from the yolk. Spheres are fitted to these two sets of nuclei, and from the radii, , and distance, d, of the two spheres, the contact angle, θ, is calculated. (c) The measured contact-angle dynamics shows a clear time dependence. Although it stays constant at the beginning of the experiments, the angle becomes smaller, corresponding to an increase in the , which finally reaches a plateau. Such a behavior corresponds to a wetting model (8), which is fitted to the experimental data (red curve). The time is displayed in minutes after egg laying. (Inset) To reduce the plotted data, 20 points (red) are binned and the mean and error (blue) are presented. To see this figure in color, go online. |

The wetting model for epiboly. (a) At the onset of epiboly, the embryo consists of the cell cluster at the animal pole of the embryo (gray) and the yolk at the vegetal pole (yellow). The cells at the cells-medium and the yolk-cells interface interact mechanically with adjacent cells, resulting in net forces of and , respectively. The mechanical interaction of the cells of the precursor film leads to the contribution to . In addition, the actomyosin ring exerts a pulling force . The units of simulations are arbitrary for space and time. The pictures used for comparison are chosen according to epiboly progression. (g) Exemplary visualization of the used grid refinement. (h) Reduction of the measured contact-angle data (blue) to binned mean values (red). To see this figure in color, go online. |