
- Title
-
Giantin knockout models reveal a feedback loop between Golgi function and glycosyltransferase expression
- Authors
- Stevenson, N.L., Bergen, D.J.M., Skinner, R.E.H., Kague, E., Martin-Silverstone, E., Robson Brown, K.A., Hammond, C.L., Stephens, D.J.
- Source
- Full text @ J. Cell Sci.
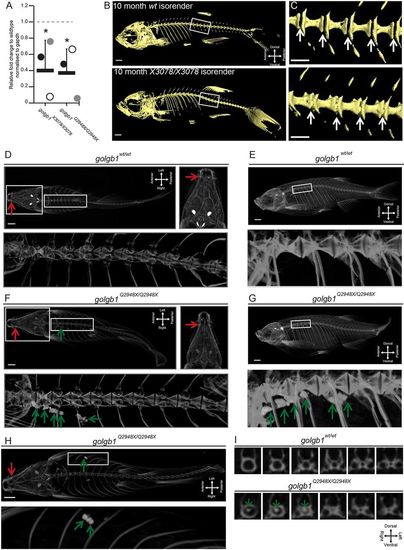
Giantin-KO zebrafish have reduced galnt3 expression and exhibit HFTC-like phenotypes. (A) Real-time qPCR pair-wise analysis of galnt3 expression at 60–63 dpf in two golgb1 mutant zebrafish lines normalised to gapdh mRNA levels as housekeeping gene. Bars show mean expression for each mutant line (n=3 per genotype group) relative to WT siblings (WT expression 1 AU depicted by dashed line). Each circle represents one individual (*P≤0.05, mean with s.d.; unpaired t-test was used as data were normally distributed). (B) Lateral views of micro-CT scans of 10-month-old WT and golgb1X3078/X3078 homozygous mutants, presented as isosurface renders. Boxed regions show enlarged regions in C. (C) Enlarged regions of the spine; white arrows demarcate intervertebral discs (IVDs), which in WT are not mineralised but in the mutant, ectopic mineralisation is seen manifesting as vertebral fusions. (D) Ventral (with high-resolution inset) and (E) lateral view micro-CT images showing craniofacial and spinal elements of a representative WT sibling (Q2948X line, n=3 females). (F–I) Three golgb1Q2948X/Q2948X female individuals showing ectopic calcium deposits in soft tissues (F, ventral view with high-resolution inset; G, lateral view of individual 1; H, ventral view of individual 2) and in spinal column (I, digital axial z-slices of individual 3). In D–I, red arrows indicate mandible joint and green arrows, ectopic deposits. Line Q2948X were imaged at 8 months post fertilisation. Scale bars: 100 µm. EXPRESSION / LABELING:
PHENOTYPE:
|
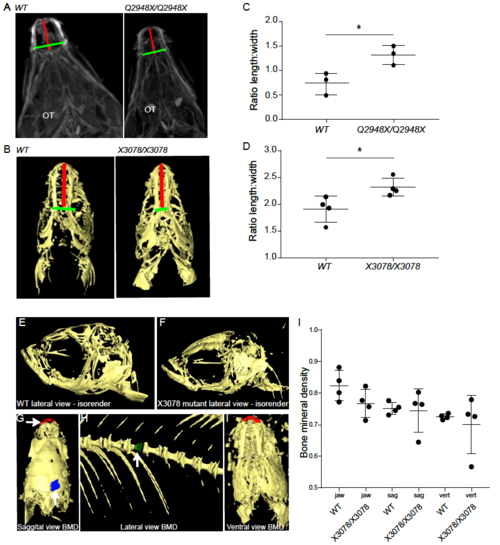
Figure S3 relating to Figure 5: (A) Ventral jaw element views in 8 months old WT and golgb1Q2948X/Q2948X zebrafish, and (B) in 10-month golgb1X3078/X3078 mutant and WT zebrafish derived from micro CT images. The relative distance from the anterior most point of the lower jaw to the mid-point between the jaw joints and the width between joints is demarked by the red and green line respectively and the ratio between these is calculated in C and D. (E, F) Ventral isorenders of the (E) WT and (F) golgb1X3078/X3078 mutants. (G-I) Red and blue patches highlight regions on isosurface renders of CT images used for calculation of BMD from a (G) saggital view of the skull, (H) lateral view of the vertebral column and (I) ventral view of the jaw. (J) Quantification of BMD shows no significant differences between WT and mutants in jaw, saggital, or vertebral measurements. Data were analysed using an unpaired t-test; p value: *= <0.05, mean and standard deviation). Data was taken from between 15 and 30 sections per fish (details in methods). PHENOTYPE:
|