
- Title
-
Ferulic Acid Promotes Hypertrophic Growth of Fast Skeletal Muscle in Zebrafish Model
- Authors
- Wen, Y., Ushio, H.
- Source
- Full text @ Nutrients
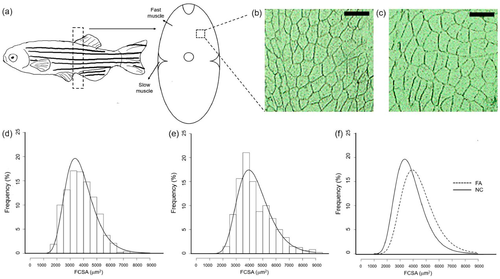
Figure 3. Effects of ferulic acid on the cross-sectional area of fast skeletal myofibers in adult zebrafish. (a) Image of fast skeletal muscle tissue used for cross section analysis. Frame with dotted line shows the position of filet dissection; Cross section of fast skeletal muscle of zebrafish from the (b) NC and (c) FA groups; Square with dotted line shows the area of (b,c). Bar represents 150 μm (d) Fiber cross-sectional area histograms for fast skeletal muscle of adult zebrafish in the NC group and (e) in the FA group; (f) Merged curves of (d,e). Samples of each group were from Population 3. FCSA: fiber cross-sectional areas (μm2) were grouped in intervals of 500 μm2. Curves represent a log-normal regression. |