
- Title
-
Coral-Derived Natural Marine Compound GB9 Impairs Vascular Development in Zebrafish
- Authors
- Song, Y.C., Wu, B.J., Chiu, C.C., Chen, C.L., Zhou, J.Q., Liang, S.R., Duh, C.Y., Sung, P.J., Wen, Z.H., Wu, C.Y.
- Source
- Full text @ Int. J. Mol. Sci.

GB9 treatment causes vascular defects during zebrafish development. (A,B) Lateral view of GB9 treatment shows less ISV growth at the top of embryo and less or no angiogenic sprouting from the caudal vein plexus (CVP) (hollow arrow in (B)) compared to untreated controls (arrows in (A)) in Tg(flk:eGFP) that expressed GFP in endothelial cells. (C) Quantification of endothelial sprouting at CVP shows a five-fold decrease in GB9-treated fish (n = 12 in control and n = 12 in GB9 sample) at 25 hpf. (D–H) At 30 hpf, bright field images showed GB9 treatment causes minor pericardial edema ((E), arrow). In untreated control embryos, ISVs reach the DLAV at the embryo’s dorsal aspect (arrowheads in (F,H)) and the CVP formed loop structures at the tail ((H), arrows). At the same stage, ISVs show slower growth at mid-somite in the GB9 treated embryos (hollow arrowheads in (G,I)) and less endothelial cell sprouting and loop formation at CVP (hollow arrow in (I)). (J,K) Quantification of percentage of completed ISV and CVP structures in GB9-treated fish at 30 hpf shows a ~2.2-fold and ca. six-fold reduction, respectively (n = 12 in control and n = 15 in GB9 treated samples). *** refers to p < 0.0001 by an unpaired Student’s t-test. Scale bars are 100 μm for (A,B,F–I), and 200 μm for (D,E). |
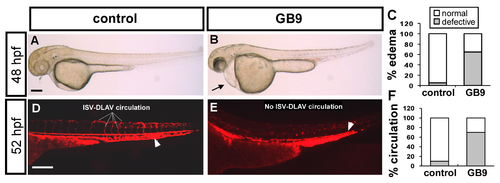
Pericardial edema and circulation defect in GB9 treated embryo. (A–C) At 48 hpf, representative edema fish (arrow in (B)) and quantitative results showed 60% of GB9 treated embryo (n = 20) with mild to severe pericardial edema compared to untreated control (n = 19). (D,E) GB9 treatment in transgenic Tg(gata1:dsRed) embryos with dsRed-labeled blood cells showed slow to no circulation at 52 hpf (E) compared to wild-type fish (D). (F) Circulation defects at the ISV/DLAV or slow to lose axial circulation of the aorta/vein in the trunk region are quantified in control (n = 18) and GB9 treated embryo (n = 18) at 52 hpf. The scale bar in (A,B) is 500 μm, and in (D,E) represents 200 μm. |

GB9 treatment inhibits the growth of ISV cells. (A–D) At 30 hpf, TUNEL labeling (in wild-type AB strain) and AO staining (in Tg(kdrl:mCherry) embryos) were used to detect apoptotic cells (arrows in (A,B) and green spots in (C,C’,D,D’)) in 0.3% DMSO control (A,C,C’), and GB9-treated embryo (B,D,D’). Some increased apoptotic cells were observed on the skin close to tail region in GB9 treated embryo, but not in vascular regions compared to untreated controls (yellow arrows in (C,C’,D,D’)). At 30 hpf, ISVs show slower growth at mid-somite in the GB9 treated Tg(kdrl:mCherry) embryos (hollow arrowheads in (D)) and less endothelial cell sprouting and loop formation at CVP (hollow arrow in D) compared to control embryos (arrowheads and arrow in (C). The number of cells forming each ISV counted in control Tg(kdrl:mCherry; fli1a:negfp y7) (E) and GB9-treated embryos (F) at 30 hpf. (G) Quantification of average endothelial cells per ISV is 3.9 ± 0.3 (ISV n = 60) and 2.2 ± 0.5 (ISV n = 80) in control and GB9 treatment respectively. ** refers to p < 0.001 by an unpaired Student’s t-test. Scale bars are 100 μm for (A–F). |
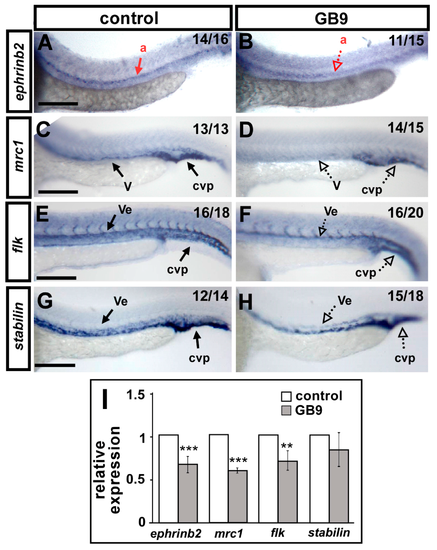
GB9 exposure reduces the expression of vascular markers. (A–H) Compared to wild-type controls (A,C,E,G), expression of the arterial marker ephrinb2 (B), venous markers mrc1 (D), pan-vascular marker flk1 (F), and stabilin (H) were reduced in the trunk dorsal aorta (a), vein (v), vessels (ve), and caudal vein plexus (cvp) at 24 hpf in GB9 treatment embryos. (I) Quantification of the relative expression level by qPCR assay showed a ~40% and 30% reduced expression in vascular markers ephrinb2 (0.65 ± 0.13), mrc1 (0.58 ± 0.05), flk (0.7 ± 0.14) and stabilin (0.84 ± 0.2) in GB9 treatment embryos. Values on the top right indicate the number of embryos exhibiting phenotype per total number of embryos analyzed. *** refers to p < 0.0001 and ** refers to p < 0.001 by an unpaired Student’s t-test. Data are represented as means ± SD. Scale bars represent 200 μm in (A–H). |

Enhanced effects of vascular defects while GB9 and H2O2 co-treatment. (A–D) Enhanced effects by combined lower dosage of GB9 treatment and lower dosage of H2O2 treatment embryos. At 30 hpf, in untreated control embryos (A), ISV have reached the DLAV (arrowheads) and the CVP with sprouting and/or loop (arrows) structures at the tail. Lower dosage of GB9 (5 μM) treatment embryos (B) or lower dosage of H2O2 (1 mM) treatment (C) showed mild or no effects in ISV growth and CVP development. Combination of GB9 treatment embryos and H2O2 treatment showed very mild vascular defects in ISV growth (hollow arrowheads in (D)) but strong effect in CVP formation (less arrows in (D)). (E,F) Quantification of percentage of completed ISV and CVP integrity showed an enhanced reduction in GB9 and H2O2 co-treated embryos (n = 11 for control, n = 10 for GB9 treatment, n = 11 for 1 mM H2O2 treatment and n = 11 for GB9, H2O2-cotreated embryos) at 30 hpf. ** refers to p < 0.001 and * refers to p < 0.01 by one-way ANOVA followed by Tukey’s post-test. Scale bars are 100 μm for (A–D). |

N-acetyl-cysteine (NAC) treatment rescues the vascular defects in GB9-treated embryos. (A,B) At 28 hpf, in untreated controls and 50 μM NAC-treated embryos, ISVs reached the DLAV at the embryo’s dorsal aspect (arrowheads) and endothelial sprouting at the CVP and some formed loop structures at the tail (arrows). (C) At the same stage, in GB9-treated embryos, ISVs showed slow growth mid-somite (hollow arrowheads) and less sprouting or loop formation at the CVP (arrows). (D) Exogenous 50 μM NAC exposure restores the vascular defects of ISV and CVP in GB9-treated embryos. (E) Percentages of completed ISV are respectively ~91 ± 2.2, 85 ± 2.9, 33 ± 5.9, and 62 ± 5.1 in controls, NAC treatment, GB9 exposure and rescued embryos. (F) Quantification of CVP structures respectively showed ~14.8 ± 0.8, 13.7 ± 0.9, 3.5 ± 0.8, and 9.2 ± 1.1 in controls, NAC treatment, GB9 exposure and rescued embryos. *** refers to p < 0.0001 by one-way ANOVA followed by Tukey’s post-test. Data represent means ± S.E. Scale bars are 100 μm for (A–D). |