
- Title
-
Three-dimensional reconstruction and measurements of zebrafish larvae from high-throughput axial-view in vivo imaging.
- Authors
- Guo, Y., Veneman, W.J., Spaink, H.P., Verbeek, F.J.
- Source
- Full text @ Biomed. Opt. Express
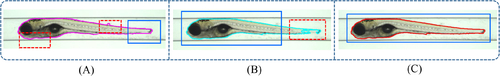
Results of various segmentation methods for zebrafish in VAST. The blue bounding box indicates an accurate part of the segmentation; red bounding box indicates an inaccurate part of the segmentation. (A) The segmentation obtained by the mean shift algorithm. This method produces a whole shape representation of the zebrafish but fails in sensitivity to the edges. (B) The segmentation obtained by the improved level set method. This method fails to detect the transparent regions as found in zebrafish tail area. (C) An accurate segmentation is obtained from a hybrid approach including the previous two methods with additional refinements. |

Visualization of 3D models of 3 zebrafish larval stages (3 dpf, 4 dpf and 5 dpf). Each box represents a reconstructed 3D model for one specific zebrafish larvae visualized from three different viewpoints. The 3D volumetric representations are shown in green on the left side in each box. The models with texture-mapping are in the right side of each box. (A) 3D models of two selected 3 dpf zebrafish larvae. (B) 3D models of two selected 4 dpf zebrafish larvae. (C) 3D models of two selected 5 dpf zebrafish larvae. Variation in size and shape between stages and within stages (interclass and intraclass) can be appreciated from the visualizations. A remarkable intraclass discrimination originates from the size and color of the yolk. In addition, animations of the 3D zebrafish models are available at: http://bio-imaging.liacs.nl/galleries/VAST-3Dimg/. |