
- Title
-
Immunomodulation-accelerated neuronal regeneration following selective rod photoreceptor cell ablation in the zebrafish retina
- Authors
- White, D.T., Sengupta, S., Saxena, M.T., Xu, Q., Hanes, J., Ding, D., Ji, H., Mumm, J.S.
- Source
- Full text @ Proc. Natl. Acad. Sci. USA
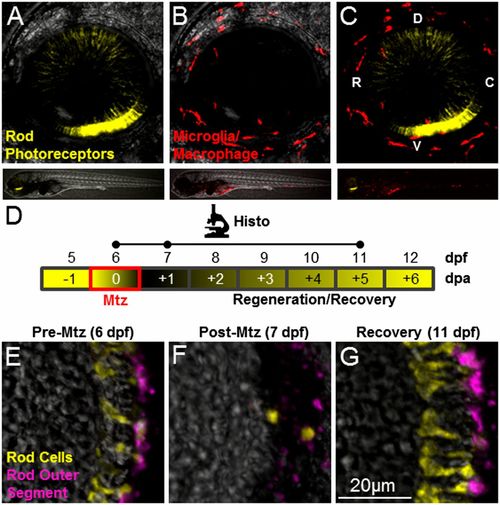
Intravital imaging and prodrug-induced cell ablation. (A–C) Whole-retina z-projection images of double-transgenic (rho:YFP-NTR;mpeg1:Tomato) 6-dpf larvae in which rod cells express YFP-NTR (A and C, yellow), and macrophage/microglia express tdTomato (B and C, red). The upper images show the whole eye (34× magnification); the lower images show the whole fish (4× magnification). (D) Schematic of the assay and analysis timeline for data shown in E–G. Retinal sections were processed for immunohistology (Histo) and imaged at time points indicated by dots on the Histo line. Mtz exposures occurred over a 24-h span at 6 dpf (red box) with loss and subsequent rod cell regeneration (black/yellow gradient) occurring over a weeklong recovery period (−1 to +6 dpa). (E–G) Retinal sections from a rho:YFP-NTR transgenic larva treated with Mtz (10 mM) for 24 h, starting at 6 dpf (E), demonstrating ablation (F), and subsequent regeneration (G) of rod photoreceptors indicated by the loss and recovery of YFP-expressing rod cells (yellow) and a rod outer segment marker (magenta, monoclonal antibody zpr-3, also known as “Fret 11”). C, caudal; D, dorsal; R, rostral; V, ventral. |
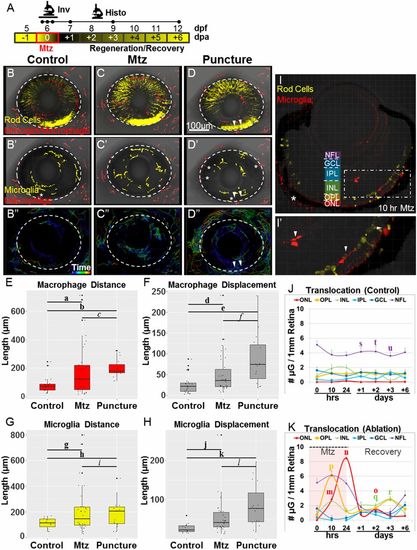
Only microglia act in the retina following rod cell ablation. (A) Schematic of timelines for intravital (Inv; the line denotes a 20-h time-lapse) and histological (Histo; the initial three dots on the Histo line denote t = 0, 10, and 24 h after exposure to Mtz) assays. (B–D) Whole-retina time-lapse sequences (10-min time interval) were collected from 6-dpf larvae with YFP-NTR–expressing rod cells (yellow in B–D) and Tomato-expressing macrophage/microglia (red in B–D). Immune cell migration paths were quantified in noninjured control (B–B′′), Mtz-treated (C–C′′), and puncture-wounded (D–D′′) retinas. B–D show representative z-projection images taken before the induction of rod cell death or puncture wounding (t = 0). B′–D′ are false-color renderings of the mpeg1:Tomato channel showing the initial positions of microglia (yellow) and macrophages (red); asterisks mark cells present in extraretinal tissue. B′′–D′′ show dragon-tail migration paths of tracked microglia and macrophage cells. Macrophages responded to rod cell death by increasing migration (C′′) but entered the retina only after puncture wounding (D′′; puncture sites are denoted by arrowheads). (E–H) Quantification of macrophage (E and F) and microglia (G and H) migration demonstrates reactivity following rod cell ablation and puncture wounding. (I–K) Somal translocation of microglia was evaluated in control (J) and Mtz-treated larvae (I, I′, and K). (I) Seven-day-postfertilization retina following 10 h of Mtz treatment (56× magnification, asterisk indicates autofluorescence). (I′) An enlarged view of the boxed region in I shows microglia in the INL, OPL, and ONL (arrowheads). (J and K) Quantification of microglia somal position showed no evidence of translocation in controls (J) but increased numbers in the OPL and ONL, concomitant to decreases in the NFL, following rod cell ablation (K). Statistics (effect sizes, 95% confidence intervals, and P values for paired comparisons denoted by letters) are provided in Table S1. For J–K, only pairs made between time point-matched control (J) and experimental (K) data showing reproducible differences are labeled with a bolded letter (error bars indicate SEM). For all others, bolded letters denote pairs showing reproducible differences, and italicized letters denote pairs with no discernible differences. |

Coablation results in delayed MG and progenitor cell proliferation. (A) Schematic of the assay timeline and the paradigm for rod cell and macrophage/microglia coablation for data shown in B–D (dots on the Histo line indicate time points as in Fig. 2). (B–B′′) Representative retinal section of a 7-dpf rho:YFP-NTR;mpeg1:Tomato;gfap:GFP larva immunostained for PCNA (blue) after 24-h exposure to Mtz. Enlarged views of boxed regions 1 and 2 show evidence of MG (green cells) phagocytosis of microglia (red cells) containing rod cell debris (yellow cells). Boxed region 3 shows an example of a proliferating MG cell following rod cell ablation (blue/green double-positive cell). Note: The prominent red signal outside the ONL in B′ and B′′ (asterisks in B′) is autofluorescence from the retinal pigment epithelium (RPE) layer and blood vessels. (C and D) Quantification of proliferating (PCNA-immunoreactive) MG (GFP+/PCNA+) and presumptive progenitor cells (PCNA+ only) in the INL (C) and ONL (D) following rod photoreceptor ablation (C, green boxes; D, yellow boxes) or rod cell and macrophage/microglia coablation (C and D, red boxes) normalized to the number of cells per 1 mm of retina (measured at the OPL). Note that retinal microglia were eliminated from the analysis of proliferating cells based on expression of the Tomato transgene (arrowheads in B′). (C) An early deficit in INL proliferation rates is evident in the coablated condition during Mtz treatment, but increased proliferation at later time points appears to compensate. (D) Deficits in ONL progenitor proliferation rates in coablated retinas persist through the second day of recovery before matching the levels observed in retinas in which only rod cells were ablated. Statistics (effect sizes, 95% confidence intervals, and P values for paired comparisons) are provided in Table S2; bolded letters denote pairs showing reproducible differences, italicized letters denote pairs with no discernible differences. Co-Abl, coablated retinas; Rod-Abl, rod photoreceptor ablated retinas. |
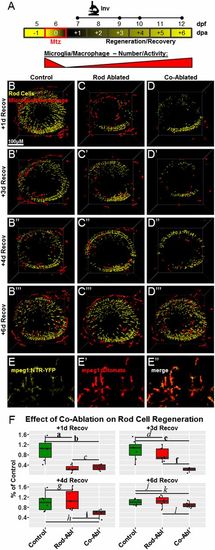
Coablation results in delayed PR regeneration. (A) Schematic of assay timeline and paradigm for rod cell and macrophage/microglia coablation for data shown in B–F. Whole-retina intravital images across the indicated time series (dots in the Inv line) track changes in YFP expression in individual fish over time. (B–D) Representative z-projection confocal images of rho:YFP-NTR;mpeg1:Tomato;mpeg1:NTR-YFP larvae from untreated control (B–B′′′), rod-ablated (C–C′′′), and coablated (D–D′′′) groups at days 1, 3, 4, and 6 of recovery. (E–E′′) Images showing complete overlap between mpeg1:NTR-YFP (E) and mpeg1:Tomato (E′) reporter expression (40× magnification), which facilitated subtraction of NTR-YFP–expressing microglia cells from all retinal YFP volume calculations. A merged image is shown in E′′. (F) Quantification of YFP expression intensity—as an indication of rod cell number—for all conditions at each time point. For both ablation conditions, rod cell loss is evident at +1 d of recovery (Upper Left). In retinas in which only rod cells were ablated, YFP intensity begins to approach control levels at +3 d of recovery (Upper Right). In contrast, coablation causes a delay in rod cell regeneration such that evidence of new rod cells cannot be detected until day 4 of recovery (Lower Left) before finally approaching control levels at +6 d of recovery (Lower Right). Statistics: The Wilcoxon rank-sum test was used for paired comparisons; corresponding P values are provided in Table S3; bolded letters denote pairs showing reproducible differences; italicized letters denote pairs with no discernible differences. |

Immunomodulatory control of rod cell regeneration kinetics. (A) Schematic of assay timelines and Dex treatment paradigms for data shown in B–F. (B–B′′) Whole-retina intravital time-lapse sequences from Mtz-treated 6-dpf rho:YFP-NTR;mpeg1:Tomato larvae and microglia migration patterns quantified ± preablation Dex exposure. (B) Exposing larvae to Dex before Mtz-induced rod cell death suppressed microglia responsiveness. (B′) Representative dragon-tail microglia migration data from the preablation Dex-treated retina group. (B′′) False-colored image showing microglia (yellow) and macrophages (red) at t = 0. (C and D) Retinal sections were processed for PCNA immunoreactivity and imaged at the indicated time points (dots in the Histo line in A). (C and D) Quantification of proliferative MG/progenitor cells in the INL (C) and ONL (D) from uninjured control retinas (dark green boxes), Mtz-treated retinas (light green boxes), and Mtz+Dex (preablation)-treated retinas (red boxes) normalized to the number of cells per 1 mm of retina (measured at the OPL). Dex pretreatment causes a decrease in proliferation in the INL and ONL after 24 h Mtz and at +1 d recovery. (E) Plate reader-based (i.e., ARQiv) quantification of rod cell regeneration kinetics (i.e., YFP intensity) in individual rho:YFP-NTR larvae at +4 d of recovery following Mtz-induced rod cell death and ± Dex exposure (pre- or postablation). Comparisons between larvae treated with Mtz alone (green boxes) or with Mtz +Dex (red boxes) preablation (Left) or postablation (Center), or with Mtz + Dex-P postablation (Right) showed that pretreatment with Dex inhibited rod cell replacement, whereas posttreatment with Dex (or Dex-P) accelerated rod cell regeneration kinetics. (Note that for logistical reasons associated with ARQiv assays, Mtz was applied at 5 dpf for this experiment.) Statistics (effect sizes, 95% confidence intervals, and P values for paired comparisons) are provided in Table S4; bolded letters denote pairs showing reproducible differences; italicized letters denote pairs with no discernible differences. |
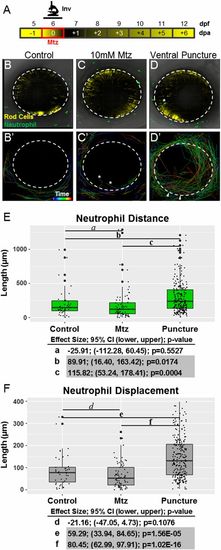
Neutrophils respond to retinal puncture wounds but not to rod cell ablation. (A) Schematic of timelines for intravital imaging assays performed in B–F. The line denotes the time during which images were collected. (B–D) Whole-retina, 20-h intravital time-lapse sequences (image interval, 20 min) were collected from 6-dpf double-transgenic rho:YFP-NTR;mpx:GFP larvae with YFP-NTR–expressing rod cells (yellow) and GFP-expressing neutrophils (green), and individual neutrophil migration paths were quantified (34× magnification). Representative z-projection confocal images of 6-dpf larvae from untreated control (B and B′), Mtz-treated (C and C′), and puncture wound (D and D′) groups. B′, C′, and D′ show the migration paths of tracked neutrophils; rainbow dragon tails show the position of each neutrophil over the 20-h time-lapse sequence (purple to red line segments). No evidence of neutrophil infiltration into the neural retina was observed in either the untreated control (B′) or rod cell-ablated (C′) condition. The asterisks mark the paths of neutrophils that migrated into extraretinal tissue over the eye. Conversely, puncture wounding (denoted by arrowheads in D′) permitted robust chemotaxis to the injury site and neutrophil infiltration into the neural retina. (E and F) Quantification of neutrophil migration patterns. Box plots show distance (E) and displacement (F) patterns across all three conditions with data from individual neutrophils displayed as a dot blot overlay (larger dots denote outliers). Increased neutrophil migration behaviors are evident only in puncture-wounded retinas. Statistical comparisons (Student’s t test) between paired groups (effect size, 95% confidence intervals, and P value) are provided in the tables below the graphs. (Note: Pairs in which CIs suggest reproducible findings are shaded gray). |

Macrophage/microglia migration postablation during the recovery phase. Confocal time-lapse microscopy was used to characterize cell migration after Mtz-induced ablation of rod photoreceptor cells in the retina. (A and B) The macrophages selected for tracking are highlighted (yellow) in control (A) and ablated (B) retinas. (C and D) Boxplots representing migration path distance (yellow, C) and displacement (gray, D) of macrophages over 20 h in control (untreated) fish and after Mtz-induced ablation. (E and F) Microglia selected for tracking are highlighted (yellow) in control (E) and ablated (F) retinas. (G and H) Boxplots representing migration path distance (yellow, G) and displacement (gray, H) over 20 h of microglia in both control (untreated) retinas and in retinas with Mtz-induced ablation. The macrophages marked by asterisks in A are subconjunctival, exterior to the RPE. The eye boundary is indicated by the dashed circle in A, B, E, and F (34× magnification). In C, D, G, and H, outliers are represented by large black dots centered on the y axis. For statistical comparisons, see the tables below the respective graphs. |

Microglia exhibit additional hallmarks of innate immune cell activation following rod cell ablation. (A) Schematic of assay timelines for data shown in B–F. (B) Representative retinal section of 7-dpf rho:YFP-NTR;mpeg1:Tomato larvae immunostained for PCNA (blue) after 24-h exposure to Mtz (56× magnification). The boxed region in B (enlarged in B′ and B′′) shows evidence of microglia phagocytosis of rod cell debris and microglia proliferation. Arrowheads in B′ denote yellow rod cell debris within red microglia. The asterisk in B′′ denotes red/blue double-positive microglia. A merged image is shown in B′′′. (C–C′′) Time-lapse sequence showing microglia (red cell) phagocytosis of rod cell debris (yellow). (D–D′′) The boxed region in C was enlarged and rotated 60° to provide additional detail (arrowheads). (E and F) Quantification of microglia proliferation (PCNA immunoreactivity) within defined somal regions in untreated control (E) and Mtz-treated (F) retinas, plotted over time. (E) Control retinas showed little to no proliferation in most somal layers. (F) Mtz-treated retinas showed increased microglia proliferation in photoreceptor regions (OPL, yellow line; ONL, red line) during the time of rod cell death and in the INL (green line) at later time points. Paired statistical comparisons (Student’s t test) made between time point-matched control (E) and experimental (F) data are denoted by a unique letter color coded according to retinal layer. Error bars in E and F indicate SEM. Effect size, 95% confidence intervals, and P values are provided in the table. (Note: Only pairs showing statistically validated differences are listed.) CMZ, ciliary margin zone. |