
- Title
-
FIJI Macro 3D ART VeSElecT: 3D Automated Reconstruction Tool for Vesicle Structures of Electron Tomograms
- Authors
- Kaltdorf, K.V., Schulze, K., Helmprobst, F., Kollmannsberger, P., Dandekar, T., Stigloher, C.
- Source
- Full text @ PLoS Comput. Biol.

Analysis of embryonic zebrafish NMJ using 3D ART VeSElecT in comparison to manual analysis using IMOD. We show in Fig 2 A) the original tomogram of 4dpf zebrafish NMJ, in Fig 2 B) the manual reconstruction is included in the tomogram of A), in B') the 3D reconstruction of the manual annotation (vesicles are colored in light blue) is shown. This is compared to Fig 2 C) which shows the semi-automated vesicle recognition overlaid with the original tomogram, and C') which shows the vesicle pool of the semi-automated annotation as 3D reconstruction (vesicles are in arbitrary colors). In D) boxplots show the results of the comparison of 4dpf and 8dpf zebrafish embryos using manual annotation (left) and semi-automated annotation (right). The box of the box plots shows the mid-50% of data. The line in the box represents the median of all data. Whiskers end at lowest value within 1.5 interquartile range (IQR) of the lower quartile and at the highest value within 1.5 IQR of the upper quartile. Data that is not included in between both whiskers are plotted as outliers with a dot. |
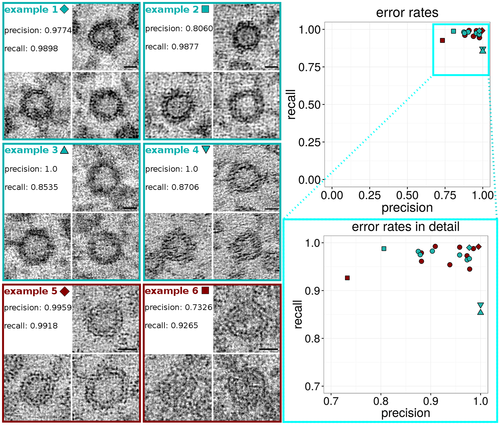
On the right, upper side a dot plot is shown, representing zebrafish (turquoise) as well as C. elegans (dark red) error rates. Each dot represents precision and recall of one tomogram (magnified detail plot on the lower right side). Tomograms that are shown as examples on the left side of the figure are represented as a special sign (e.g. triangle or square) instead of a round dot in the plot. On the left side, example 1 shows vesicles of a high quality tomogram, with good results for recall (low number of false negatives) and precision (low number of false positives). In comparison to one tomogram with worse precision (example 2) and two tomograms (example 3 and 4) with a higher rate of false negative vesicles, i.e. lower recall. Furthermore, examples 5 and 6 show vesicles of one tomogram with best precision and recall rate (example 5) in comparison to one tomogram with very low precision. Scale bars: 20 nm. |