
- Title
-
Overexpression of TGF-β Inducible microRNA-143 in Zebrafish Leads to Impairment of the Glomerular Filtration Barrier by Targeting Proteoglycans
- Authors
- Müller-Deile, J., Gellrich, F., Schenk, H., Schroder, P., Nyström, J., Lorenzen, J., Haller, H., Schiffer, M.
- Source
- Full text @ Cell Physiol. Biochem.
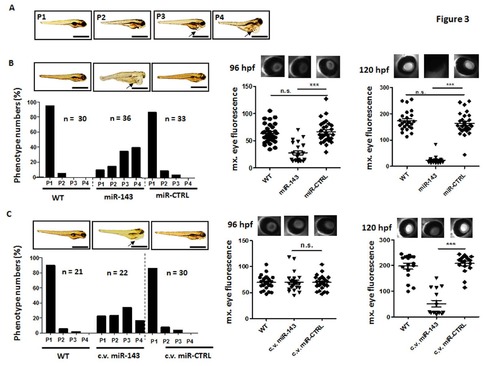
Overexpression of miR-143 causes edema and proteinuria in zebrafish larvae. Edema quantification of zebrafish larvae at 120 hpf. (A) Representative phenotype of the larvae categorized into 4 groups: P1 = no edema, P2 = mild edema, P3 = severe edema, P4 = very severe edema. Zebrafish were injected with a miR-143 mimic (5 μM) or miR-CTRL (5 μM) at one to four cell stage (B) or in the cardinal vein (c.v.) at 48 hpf (C) as indicated. Left panels depict phenotype percentages with corresponding representative phenotype images. Right panels indicate results of the eye assay for proteinuria with corresponding representative fluorescent images of the retinal vessel plexus of Tg(l-fabp:DBP:EGFP) of zebrafish larvae expressing a high molecular weight fluorescent protein in the circulation at 96 hpf and 120 hpf. Bar graphs presenting maximum fluorescence intensity of the fish eye as analyzed with image J. *** p<0.001, n.s. not significant; hpf: hours post fertilization. D: Q-PCR for relative sdc2, 3, 4 and vcan mRNA expression in whole zebrafish tissue at 120 hpf. Zebrafish were injected with a miR-143 mimic (5 μM) or miR-CTRL (5 μM) at one to four cell stage as indicated. Expression levels are compared to miR-CTRL and given as fold change. * p< 0.05, ** p<0.01, *** p<0.001. |

Knockdown of syndecan 2 and versican causes edema and proteinuria in zebrafish larvae. (A) Edema quantification of zebrafish larvae at 120 hpf. Zebrafish were injected with a specific morpholinos for syndecan 3 (sdc3-MO, 100 μM), syndecan 4 (sdc4-MO, 100 μM), versican (vcan-MO, 100 μM), a scrambled control (CTRL-MO, 100 μM) or a combination of syndecan 3 (sdc3- MO, 100 μM) and syndecan 4 (sdc4-MO, 100 μM) at the one to four cell stage as indicated. The edema phenotypes of the larvae were categorized into 4 groups: P1 = no edema, P2 = mild edema, P3 = severe edema, P4 = very severe edema. (B) Corresponding fluorescent images of the retinal vessel plexus of Tg(lfabp: DBP:EGFP) of zebrafish larvae expressing a high molecular weight fluorescent protein in the circulation. Scatter graph presents maximum of circulating fluorescence intensity in the fish eye at 120 hpf, analyzed with image J. *** p<0.001, n.s. not significant; hpf: hours post fertilization. PHENOTYPE:
|
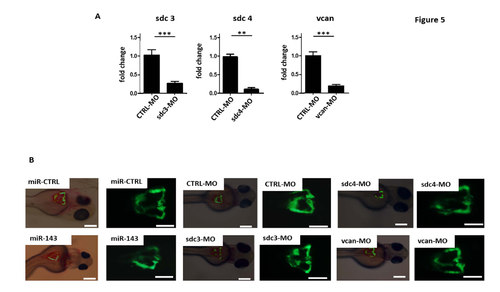
Quantification of target knockdown after versican and syndecan morpholino injection and fusion of zebrafish glomeruli at 48 hpf after versican and syndecan knockdown. (A) Q-PCR for relative sdc 3, 4 and vcan mRNA expression in whole zebrafish tissue at 120 hpf. Zebrafish were injected with syndecan 3 morpholino (sdc3-MO, 100 μM), syndecan 4 morpholino (sdc4-MO, 100 μM), versican morpholino (vcan- MO, 100 μM) or control morpholino (CTRL-MO, 100 μM) at one to four cell stage as indicated. Expression levels are compared to miR-CTRL and given as fold change. ** p<0.01, *** p<0.001. (B) Pictures illustrate glomerular fusion of transgenic zebrafish that expresses eGFP under the control of the wt1b promotor (wt1b:EGFP zebrafish) at 48 hpf. Zebrafish were injected with miR-143 mimic (miR-143, 5 μM) or miR control (miR-CTRL, 5 μM), syndecan 3 morpholino (sdc3-MO, 100 μM), syndecan 4 morpholino (sdc4-MO, 100 μM), versican morpholino (vcan-MO, 100 μM) or control morpholino (CTRL-MO, 100 μM) as indicated. Right pictures depicts glomerular fusion in fluorescent channel. Scale bar: 200 μm. Left pictures illustrates a merged picture of bright field and fluorescent channel. Scale bar: 200 μm. PHENOTYPE:
|
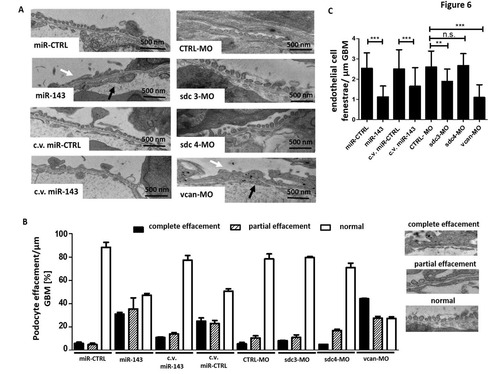
Glomerular damage after miR-143 overexpression and knockdown of syndecan and versican in zebrafish larvae. (A) Transmission electron microscopy pictures of the pronephros of zebrafish larvae at 120 hpf after injection with a syndecan 3 morpholino (sdc3-MO, 100 μM), syndecan 4 morpholino (sdc4-MO, 100 μM), versican morpholino (vcan-MO, 100 μM) or control morpholino (CTRL-MO, 100 μM), as well miR- 143 mimic (miR-143, 5 μM) or miR control (miR-CTRL, 5 μM). White arrows illustrate podocyte effacement. Black arrows illustrates loss of endothelial cell fenestration. (Aa) Normal, partial and complete effacement of podocytes was quantified in the different groups. (Ab) Quantification endothelial cell fenestration per μm GBM. *** p<0.001, n.s. not significant. PHENOTYPE:
|