
- Title
-
Biological response of zebrafish embryos after short-term exposure to thifluzamide
- Authors
- Yang, Y., Liu, W., Mu, X., Qi, S., Fu, B., Wang, C.
- Source
- Full text @ Sci. Rep.

Histologic lesions in zebrafish embryos after exposure to thifluzamide for 4 days. (A) Brain from control group (arrows) (200×); A-1. Brain from 2.85 mg/L thifluzamide group showing obvious decreased cells number (arrows) (200×); (B) Yolk sac (asterisks) and pericardial region (arrows) from control group (100×); B-1. Yolk sac edema caused by 2.85 mg/L thifluzamide (asterisks) (100×); B-2. Expansion of pericardial space (arrows) due to pericardial edema in larvae (100×) and yolk sac edema (asterisks) caused by 2.85 mg/L thifluzamide (100×); (C) Gas bladder from control group showing inflated lumen (asterisks) (100×); C-1. Uninflated gas bladder caused by 2.85 mg/L (asterisks) (100×). |
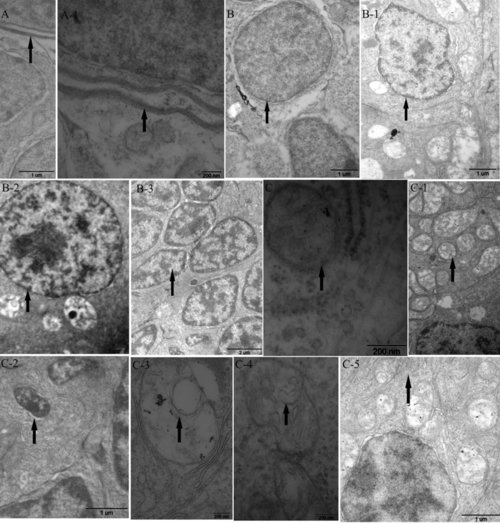
TEM observation in embryos after exposure to thifluzamide for 4 days. (A) Intact cell membranes from control group; A-1. Cell membranes from 0.19 mg/L groups; (B) Large, round nucleus from control groups; B-1. Nuclei deformation from 0.19 mg/L groups; B-2. Chromatin condensation from 0.19 mg/L groups; B-3. Chromatin condensation and nuclear fragmentation from 2.85 mg/L groups; (C) Mitochondria from control group showing distinct crista and intact membranes; C-1. Mild damage to mitochondria from 0.19 mg/L groups; C-2. Apoptotic body from 0.19 mg/L groups; C-3. Mitochondrial damage showing crista degradation from 2.85 mg/L groups; C-4. Mitochondrial swelling showing membrane degradation from 2.85 mg/L groups; C-5. Endoplasmic reticulum breakup from 2.85 mg/L groups. Arrows indicate the different sections. |