FIGURE SUMMARY
Title

Innovative approaches to establish and characterize primary cultures: an ex vivo 3D system and the zebrafish model.

Authors
Liverani, C., La Manna, F., Groenewoud, A., Mercatali, L., Van Der Pluijm, G., Pieri, F., Cavaliere, D., De Vita, A., Spadazzi, C., Miserocchi, G., Bongiovanni, A., Recine, F., Riva, N., Amadori, D., Tasciotti, E., Snaar-Jagalska, E., Ibrahim, T.
Source
Full text @ Biol. Open

Characterization of the ex vivo 3D tumor model. (A) Scanning electron microscopy (SEM) analysis of collagen-based scaffolds at different magnifications. Images were taken with a FEI Nova NanoSEM microscope. (B) Pictures of collagen scaffolds pre- and post-cellularization with primary liposarcoma cells and hematoxylin & eosin staining of paraffin-embedded sections of the scaffold pre- and post-cellularization (C) Hematoxylin & eosin staining of paraffin-embedded sections of 3D scaffolds cultured with primary liposarcoma cells and of the histological specimen. Arrowheads indicate tumor cells. (D) Inverted microscopy pictures of 2D-cultured and 3D-recovered liposarcoma cells.

Sensitivity of primary liposarcoma cells to chemotherapy drugs. (A) Survival percentages of primary liposarcoma cells not treated (CTR), treated with epirubicin plus ifosfamide (EPI IFO) or treated with trabectedin (TRABE). Data are mean±s.d. (n=5). Unpaired t-test. (B) TUNEL staining of primary liposarcoma cells CTR, EPI IFO, TRABE (green, TUNEL positive cells; blue, nuclei stained with DAPI). Images were analyzed with Image J software (NIH Image, Bethesda, MD). Percentages of TUNEL-positive primary liposarcoma cells not treated, treated with epirubicin plus ifosfamide or treated with trabectedin. Data are mean±s.d. (n=5).

Representative stereo micrograph images of primary liposarcoma cells (green, CFSE) injected into 2 dpf Tg(Kdrl:mCherry) zebrafish embryos. Images taken at (A) 1 dpi and (B) 4 dpi. White circles indicate the area zoomed in the close-ups; white asterisks indicate the injected cells (A) and the invading cells (B). The number of engrafted foci per embryo is reported. Quantification of total number of engrafted foci at 1 and 4 dpi (C) (mean±s.d., n=4) and quantification of engrafted foci in the three different anatomical regions of the zebrafish embryos (D) (mean±s.d., n=3). White, tail region; gray, body region; black, head region. At 4 dpi, we detected that liposarcoma-derived cells survived in vivo and spread from the injection site. Of note, injected embryos showed an aspecific CFSE signal in the gastrointestinal trait of the embryos, at the initial timepoint of the experiment (1 dpi), due to dye leakage. This aspecific signal faded out at the later timepoint, as visible in the pictures of 4 dpi embryos.


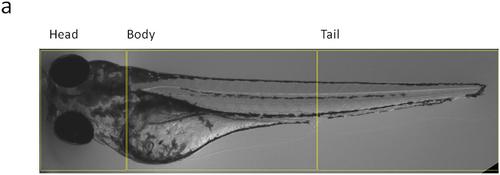
 Brightfield image of a zebrafish embryo, showing an example of segmentation into 3 different anatomical regions (head, body and tail) in which the engrafted foci of the injected patient-derived cells were quantified. 

Acknowledgments
This image is the copyrighted work of the attributed author or publisher, and ZFIN has permission only to display this image to its users. Additional permissions should be obtained from the applicable author or publisher of the image. Full text @ Biol. Open