
- Title
-
Chronic perfluorooctanesulfonic acid exposure disrupts lipid metabolism in zebrafish
- Authors
- Cui, Y., Lv, S., Liu, J., Nie, S., Chen, J., Dong, Q., Huang, C., Yang, D.
- Source
- Full text @ Hum. Exp. Toxicol.
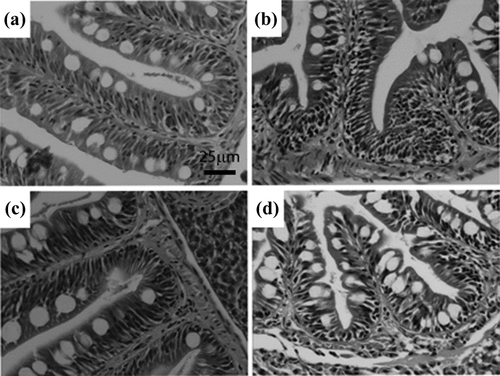
H&E staining of small intestine from F0 after exposed to PFOS for 180 days. Representative intestine sections from control female (a) and male (b), female exposed to 0.5 μM PFOS (c) and males exposed to 0.5 μM PFOS (d). Compared with the control males, the number of goblet cells was higher in PFOS-treated males, while the number of columnar cells decreased. There were no significant morphological changes in female following PFOS exposure. Scale bar: 25 µm; n = 5 fish per sex from each group. PFOS: perfluorooctanesulfonic acid; H&E: hematoxylin and eosin. |
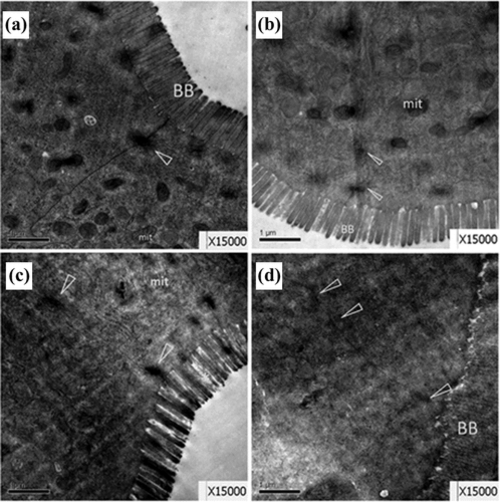
Representative TEM images showing small intestine ultrastructure from control females (a) and males (b), and 0.5 μM PFOS-exposed females (c) and males (d). In all females treated with PFOS (c), shrunk or swelling microvilli appeared alternately on the brush border (BB). In all males treated with PFOS, epithelium microvilli disconnected and fell off to intestinal lumen (d). Tight junction (▵) between cells was obscure, cytoplasmic matrix were distributed unevenly; n = 5 fish per sex from each group. TEM: transmission electron microscopic; PFOS: perfluorooctanesulfonic acid. |
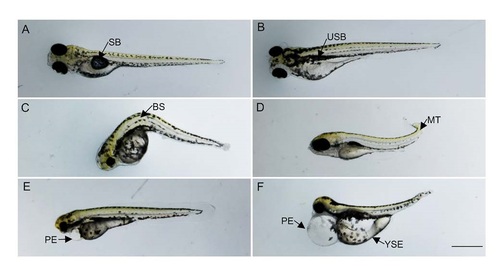
Representative images showing various malformation observed in Fl derived from parental zebrafish chronically exposed to 0.5µM PFOS. (A) Normal larvae at 120hpf; (B-D) malformed larvae at 120hpf. Note: swim bladder (SB), uninflated swim bladder (USB), bent spine (BS), malformed tail (MT), pericardial edema (PE), yolk sac edema (YSE). Scale bars = 1.0 mm. |