
- Title
-
Real-Time Three-Dimensional Cell Segmentation in Large-Scale Microscopy Data of Developing Embryos
- Authors
- Stegmaier, J., Amat, F., Lemon, W.C., McDole, K., Wan, Y., Teodoro, G., Mikut, R., Keller, P.J.
- Source
- Full text @ Dev. Cell

Whole-Embryo Cell Segmentation in Fruit Fly, Zebrafish, and Mouse (A) Maximum-intensity projections of 3D image datasets of fruit fly, zebrafish, and mouse embryos expressing fluorescent markers labeling all membranes. Image data were acquired with light-sheet fluorescence microscopy (Tomer et al., 2012). The fruit fly embryo was imaged at 3 hr after egg laying (AEL), the zebrafish embryo at 6 hr post fertilization (hpf), and the mouse embryo at E6.5 (Experimental Procedures). Scale bar, 50 µm. (B) Segmentation results, visualized as renderings of sliced embryos. Cells in the exposed cross-sections are shown in an orange/red color scheme, and in a cyan/blue color scheme for the rest of the embryo. Insets show enlarged views of the cell segmentation results. (C) As in (A), but for fruit fly, zebrafish, and mouse embryos imaged with confocal fluorescence microscopy (Zeiss LSM 510 and LSM 710 microscopes). The fruit fly embryo was imaged at 3 hr AEL, the zebrafish embryo at 6 hpf, and the mouse embryo at E7.5 (Experimental Procedures). Scale bar, 50 µm. (D) Segmentation results for the image data shown in (C). |
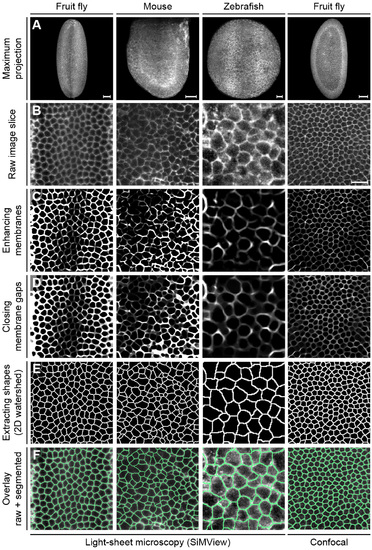
Related to Figure 1. Fast and accurate slice-based 2D segmentation Illustration of the main processing steps performed prior to fusion of the 2D segments. Maximum intensity projections of 3D image stacks of Drosophila, mouse and zebrafish embryos recorded with SiMView light-sheet microscopy and confocal fluorescence microscopy are shown in panel (A). Based on the raw membrane image (B, xy-image is shown, i.e. an image slice oriented perpendicular to the microscope’s optical detection axis), a Hessian-based objectness filter is used to enhance membrane structures (C). Remaining holes in the cell membranes are repaired using iterative morphological closing with increasing structure element sizes (D). The actual segmentation is performed using a standard watershed algorithm on the 2D slices (E). The last row (F) shows the watershed pixels superimposed with the raw images. Image contrast has been adjusted for better visibility. Scale bars, 50 µm (A), 20 µm (B). |

Related to Figure 1. Efficient seed-based fusion of 2D segments to 3D cell shapes. Illustration of final segment fusion steps for 3D cell shape segmentation in cell membrane image data (A, xz-image is shown, i.e. an image slice oriented parallel to the microscope’s optical detection axis). The initial slice-based segmentation of the 2D morphological watershed operator (B) and the extracted seed segments are combined to reconstruct 3D cell shapes (C). 2D segments touching a seed segment are labeled with the unique seed identifier. Based on segment similarity across slices, 2D segments touching one of the labeled initialization segments are then iteratively merged to form complete 3D cell shapes, starting with the highest-scoring segments. In some cases, the 3D segmentation results (C) can be further improved by one of the two proposed fusion heuristics. Segments with few slices (indicated by * in panel (C)) are fused to their closest neighbor if the specimen-dependent maximum volume constraint is not violated by this merge. If the fusion of segments is suggested by the similarity-based fusion heuristic (D), two subcellular compartments produced in the initial seed-based segmentation (indicated by # in panel (C)) are fused to obtain the final 3D segmentation (E, F). Both fusion heuristics simply assign the same unique identifier to those segments that should be merged, thus producing a single corrected 3D cell shape. For specimens with diverse cell sizes, the fusion heuristics might not be able to further improve results (see e.g. the almost identical results obtained for the zebrafish and mouse panels shown before (C) and after (E) application of the fusion heuristics; see also Part 1 of Supplemental Experimental Procedures). We note that most of the small fragments visible in (E) and (F) are not over-segmentation artifacts but rather cell cross-sections belonging to cells whose centers are located outside the xz-slice shown here. Scale bar, 20 µm. |
Reprinted from Developmental Cell, 36, Stegmaier, J., Amat, F., Lemon, W.C., McDole, K., Wan, Y., Teodoro, G., Mikut, R., Keller, P.J., Real-Time Three-Dimensional Cell Segmentation in Large-Scale Microscopy Data of Developing Embryos, 225-240, Copyright (2016) with permission from Elsevier. Full text @ Dev. Cell