
- Title
-
Evolutionary conserved brainstem circuits encode category, concentration and mixtures of taste
- Authors
- Vendrell-Llopis, N., Yaksi, E.
- Source
- Full text @ Sci. Rep.
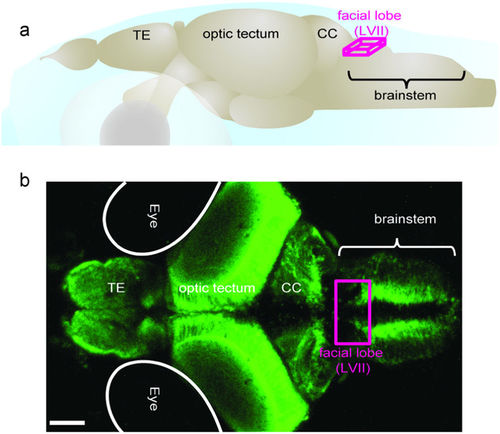
Schematic representation of zebrafish brain. (a) Illustration of 21 days old zebrafish brain. Magenta lines delineates the facial lobe of the brainstem, which is the main focus of this study. Major brain regions are labelled. Abbreviations: LVII facial lobe of the brainstem; CC, cerebellum; TE, telencephalon; (b) Maximum projection image of a 21dpf elavl3:GCaMP5 zebrafish brain across 320 μm depth. The magenta square indicates the facial lobe of zebrafish brainstem. Scale bar 100 μm. |
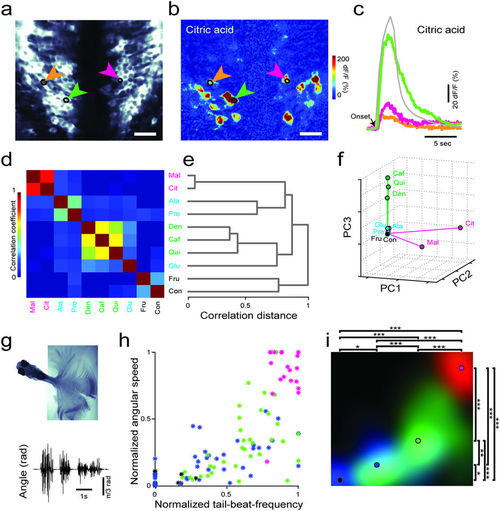
Taste categories are represented by dissimilar neural activity in the brainstem and generate different behaviors. (a) Optical section of the facial lobe in zebrafish brainstem expressing GCaMP5 under HuC promoter in most neurons. (b) Taste-evoked neural responses in the same optical section. Three arrows point to corresponding neurons from panel a. Scale bars 20 μm. Stimulus is citric acid 5 mM (c) Time course of the stimulus delivery in grey and time course of taste-evoked responses of example neurons color-coded same as in panel a. Black arrow indicates stimulus onset. (d) Pair-wise Pearson’s correlations between neural responses to different tastants. Text colors represent magenta = sour, green = bitter, blue = amino acids, black = sweet. n = 721 neurons, across 10 fishes. (e) Dendrogram showing the linkage among taste categories. Distances are measured based on correlations. (f) Representations of taste responses with the first 3 principle components. Total variance explained by first 3 principal components is 97.2% (g) Motor behavior of a semi-restrained zebrafish, obtained from a video sequence projected in time (top) and the associated tracking of the tail angle (bottom) in response to citric acid delivery. (h) TBF versus ATS in response to different taste categories, sour (magenta), bitter (green) and amino-acids (blue). Each dot represents an average of three different trials from individual fish (n = 12 fish) during the first four seconds. These values are normalized to the maximum response of each fish. Max ATS = 2.9 ± 1.2πrad/s, Max TBF = 24.2 ± 2.6 Hz. (i) Behavioral taste map obtained by filtering the graph in panel h. Colored circles represent averaged values across all fish. All categories generate significantly different behaviors. (***p = <0.0005, **p = <0.005, *p = <0.05 by Mann-Whitney U-test). For abbreviations, please see methods. |

Taste mixtures exhibit suppressive and synergistic interactions, which are dynamically modulated by the taste concentration and category. (a) Schematic representation for quantifying mixture interactions. Taste responses of two representative neurons, which show synergy (left) and suppression (right) respectively. Individual and mixtures taste responses(black) and predictions based on synergy and suppression rules as described in methods (grey). (b) Representative facial lobe neurons from individual zebrafish are color coded by the mixture interactions they exhibit (suppression = magenta, synergy = green, rest = grey) in response to mixtures of sour tastants (citric acid and malic acid) at different concentrations. (c) Ratio of all neurons (left) and responding neurons (right) exhibiting synergy or suppression changes dynamically with changing concentrations. N = 1129 neurons in 7 fish. (d) Representative facial lobe neurons are color coded for suppressive and synergistic interactions for the mixtures of sour (citric acid) and bitter (quinine-HCl) taste. White scale bars are 20 μm for b and d. (e) Ratio of all neurons (left) and responding neurons (right) exhibiting synergy or suppression for sour/bitter mixtures (for c and e ***p = <0.0005, **p = <0.005, *p < 0.05 by Wilcoxon signed-rank test, ns = not significant, n.a = not applicable). N = 490 neurons in 7 fish. Error bars are standard error of the mean across fish for c and e. (f) TBF and ATS of zebrafish in response to citric acid (magenta), quinine-HCl (green) and their mixture (blue) at 5 mM concentrations. Each dot represents a three trial average from individual fish (n = 15 fish) during first four seconds. Max ATS = 1.9 ± 0.7πrad/s. Max TBF = 24.8 ± 4.0 Hz. (g) Behavioral taste map obtained by Gaussian filtering the graph in f. Colored circles represent average values across all fish. All combinations generate significantly different behaviors (***p = <0.0005, **p = <0.005, *p < 0.05 by Wilcoxon signed-rank test, ns = not significant). (h) Dose dependent average amplitude for the neural responses to mixtures of citric acid and quinine-HCl. Citric acid concentration is kept at 3 mM and quinine-HCl concentration is gradually increased morphing the mixture responses. Error bars are standard error of the mean. (i) Pair-wise Pearson’s correlations between neural responses to morphing mixtures of citric acid and quinine-HCl. Note the abrupt change in the pairwise similarity of neural responses. N = 259 neurons in 10 fish. |

Reproducibility and robustness of taste responses. a) An example for the reproducibility/trial-to-trial variability of the taste-evoked neural responses in zebrafish brainstem. b) Pair-wise Pearson’s correlations representing the trial-to-trial variability between neural responses to different tastants in the same fish as supplementary figure 1a. We measured reproducibility (solid boxes) by comparing trial-to-trial variability across same tastants. We also measured robustness (dashed boxes) by comparing individual taste trials to the averaged response to 3 trials of same taste. Note that the tastants with prominent responses e.g. sour, bitter compounds and amino-acids have low trial-to-trial variability and high robustness. In all of our analysis we used the 3 trial average of the taste responses to ensure reproducibility. c) Left: correlations across trial-to-trial variability in individual fish within individual tastants, same as solid boxes from supplementary figure 1b. Right: correlations of individual trials to the average response of all 3 trials (left), same as dashed boxes from supplementary figure 1b. Error bars represent the standard error of the mean. |

Response of brainstem neurons to different tastants a) Optical section of the facial lobe in zebrafish brainstem expressing GCaMP5 under HuC promoter in most neurons. b) Taste-evoked neural responses in the same optical section to all tastes used in this study including the blank control. Response time courses of identified neurons are plotted on the right of each activity map. Responding neurons are in black, neurons classified as non-responsive are in gray. |

Bitter tastants suppress sour taste responses when mixed together a) Activity map in response to citric acid, caffeine, denatonium, quinine-HCl and citric acid mixed with these bitter substances, all molecules at 10mM each. Relative change in fluorescence intensity is color coded. Please note that quinine-HCl elicit the strongest suppression of citric acid responses when mixed together. White bars are 20 μm. Pair-wise Euclidean distances (b) and principle component representations (c) of neural responses to different citric acid/quinine-HCl mixtures. Note the sharp transition between the neural representations of taste mixtures both for Euclidean-distances and the first 3 principle component representations, similar to the pair-wise correlation coefficients in Figure 4i |