
- Title
-
A feedback regulatory loop involving p53/miR-200 and growth hormone endocrine axis controls embryo size of zebrafish
- Authors
- Jing, J., Xiong, S., Li, Z., Wu, J., Zhou, L., Gui, J.F., Mei, J.
- Source
- Full text @ Sci. Rep.
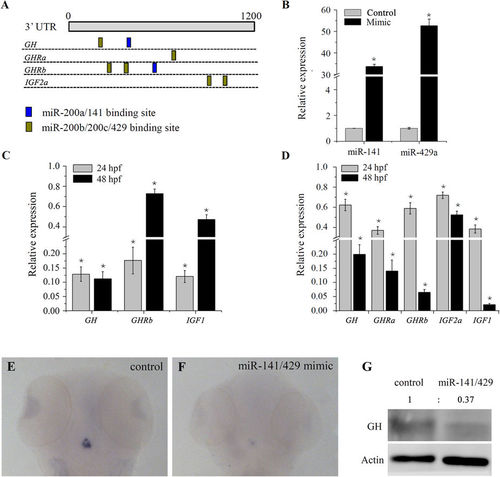
miR-200 s repress expression of multiple GH/IGF axis genes during embryo development. (A) Summary of the binding site of miR-200s in the GH/IGF axis genes predicted by Targetscan. (B) Expression of miR-141 and miR-429a in 24 hpf embryos injected with control or miRNA mimics. (C,D) Expression of GH/IGF axis genes in embryos injected with miR-141 and miR-429a mimic, respectively. (E,F) Whole mount in situ hybridization of GH in control and miR-141/429a mimic injected embryo at 48 hpf. (G) Protein expression of GH measured by western blot in 48 hpf embryo injected with miRNA mimics. (B–D) Error bars indicate mean ± SD, n = 3. Student’s t-test was used for statistical analysis (*p < 0.05). |
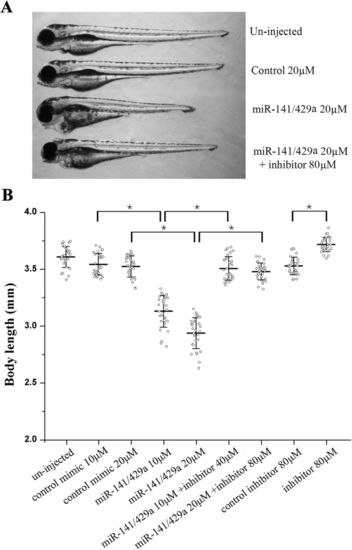
miR-200 s regulate somatic growth in zebrafish embryo. (A) Representative fish at 72hpf following injection with miRNA mimics and their inhibitors. (B) Body lengths (jaw to tail fin) of zebrafish embryos at 72hpf showed a dose-dependent suppression of somatic growth following ectopic expression of miR-141/429a mimics, and co-injection of miR-141/429a inhibitors partially rescued the growth defect. The indicated concentration of control mimic and inhibitor were used as control for the miR-141/429a mimics and inhibitors, and they have no obvious toxic effect on the embryo development. Error bars indicate mean ± SD, n = 30. Student’s t-test was used for statistical analysis (*p < 0.05). |

Analysis of cell proliferation and apoptosis phenotypes in zebrafish embryo with miR-200s overexpression. (A) Representative images of FACS analysis of DNA content in 48 hpf zebrafish embryo following injection with miRNA mimics and their inhibitors. (B) Graphical and tabular data for the percentage of cells population at G1, S, G2/M stages. Tukey’s test was used to compare the mean values among the experiment groups. Different letter indicated statistical significance. (C) The cell death phenotypes in whole embryos were revealed by AO staining (a–c) and apoptosis phenotypes in the tails were revealed by TUNEL assays (d–f), respectively. |