
- Title
-
Long-lasting effects of dexamethasone on immune cells and wound healing in the zebrafish
- Authors
- Sharif, F., Steenbergen, P.J., Metz, J.R., Champagne, D.L.
- Source
- Full text @ Wound Repair Regen.

Overview of the experimental procedure: (A) time line of the experimental procedures experiment 1. Analyses 2 and 3 were performed at 4 dpf while analyses 1 and 3 were done at 5 dpf. (B) Time line of experiment 2 (C) caudal fin amputation, amputation plane (boxed area). (D) Morphological analysis. Top (normal tail), middle (Tail cut), bottom (area ‘r’ is regenerated caudal fin at 5 dpf). Analysis 1 includes the measurement of regenerated area caudal fin. Analysis 2 includes necrosis, cell proliferation, and apoptosis assays. Analysis 3 includes RT-qPCR analysis for expression of GR, MR, hoxd11, msxb, Wnt3a, and RARγ mRNA′s, quantitative analysis of L-plastin-positive macrophages, and qualitative assessment of neutrophil and macrophage migration in lysC: DsRED2 transgenic embryos. Abbreviations: DEX, dexamethasone; GR, glucocorticoid receptor; MR, mineralocorticoid receptor; nc, notochord; cf, caudal fin; N/A, not applicable; dpf: days post fertilization. |
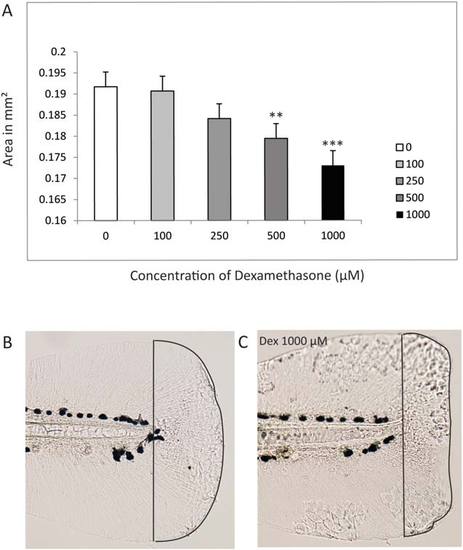
(A) Effect of varying dosages of DEX on tissue regeneration. (B) Area of caudal fin of control larva amputated at 3 dpf and regenerated for 48 hours (C) area of caudal fin of DEX treated larva after 48 hours regeneration. |

(A) Number of proliferating cells in the regenerated caudal fin 24–30 hpa, white column represents control and black column represents DEX treated larvae. (B) Confocal images of proliferating cells (red) labeled with BrdU. (C) Number of necrotic cells labeled with acridine orange. (D) Confocal images of (a) control 4 hpa and DEX treated 4 hpa (b), control 24 hpa (c), and DEX 24 hpa (d) showing necrotic cells (fluorescent) in the regenerating tail. (E) Number of apoptotic cells labeled with TUNEL staining at 4 hpa and 24 hpa. (F) Confocal images of control 4 hpa (a) and DEX 4 hpa (b), 24 hpa control (c), and 24 hpa DEX (d) dead cells (fluorescent). Scale bar in Figure 4A–F = 50 µ. |
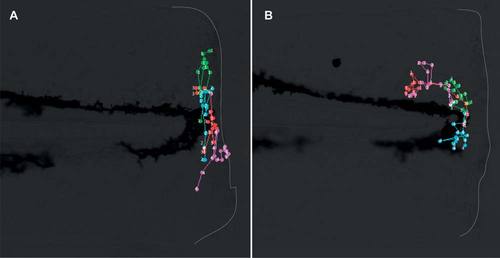
(A) Overlay of regenerating caudal fin of control embryo. Four individual cells tracked through time to record the migration pattern, labeled as 1, 2, 3, 4. The time series was superimposed to show the complete path taken by each cell. Line demarcates the boundary of regenerating caudal fin. Each labeled dot represents the position of each cell at a particular time. (B) Overlay image of DEX treated embryo showing the migration path taken by four individual cells labeled as cell 1, 2, 3, 4. |
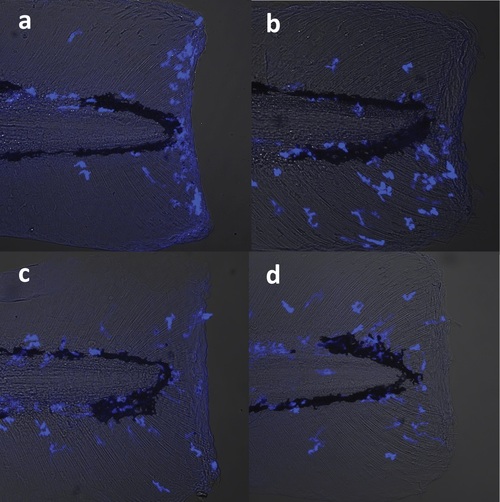
Overlay of confocal and transmitted image showing macrophages (fluorescent) in the regenerating caudal fin region: (a). controls (b). DEX-treated larvae at 4 hpa and (c). Control (d). DEX-treated larvae at 24 hpa. |
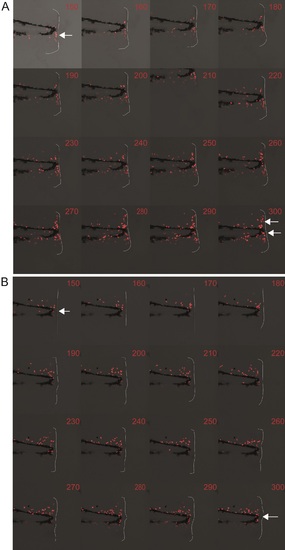
(A) Time-lapse imaging. Different frames as recorded, showing the migration pattern of Lys ds Red positive macrophages/neutrophils in control larva. Numbers on each frame show time in min after the amputation. Arrow shows cells near amputation plane, line shows boundary of the regenerating caudal fin. (B) Each frame showing the migration pattern of macrophages/ neutrophils in DEX treated embryo. (The arrow points towards cells and line demarcates the boundary of regenerating caudal fin. |