
- Title
-
Generation of Viable Plant-Vertebrate Chimeras
- Authors
- Alvarez, M., Reynaert, N., Chávez, M.N., Aedo, G., Araya, F., Hopfner, U., Fernández, J., Allende, M.L., Egaña, J.T.
- Source
- Full text @ PLoS One

Microinjection of Chlamydomonas reinhardtii into the zebrafish yolk. C. reinhardtii were injected in the middle upper part of early embryos and a green spot was clearly observed at the injection site (A, black arrow). After injection a rapid movement of algae toward the animal pole was observed. Whithin the first 10 minutes most of the algae were quiclky acumulated in the blastodisc and as early as 20 minutes after injection single alga moved to the blastodisc boundary zone (B). The white arrow follows the movement of algae every 30 seconds (C). Scale bar represents 200 µm. n ≥ 100. |

Distribution of Chlamydomonas reinhardtii in early zebrafish embryos. A zebrafish embryo at one cell stage was injected with a suspension of algae, raised to the 16 cell stage (1.5 hpf) and processed for immunohistochemistry. The blastoderm was imaged under confocal microscopy to reveal that microalgae were mainly located intracellularly. Cell membranes stained with anti-β-catenin antibody are shown in green, while C. reinhardtii is observed in red (autofluorescence). A Z-stack projection is shown on the left and a reconstructed Y projection view of the same embryo is observed on the right. Scale bar represents 200 µm. n ≥ 10. |
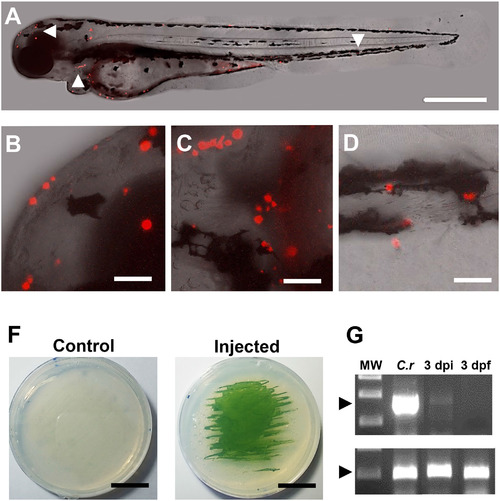
Distribution and viability of microalgae in the zebrafish larvae. C. reinhardtii was microinjected and visualized at 3 dpf. Results shows that algae distribute along the whole larva (A), including anterior (B), meddle (C) and posterior areas (D). At 3 days post fertilization (3 dpi), injected or control embryos were disaggregated and placed in agar plates, showing the capacity of the alga to re-growth ex-vivo (F). RT-PCR shows the expression of the alga specific gene psbD in RNA extracts obtained from C. reinhardtii (C.r) and fishes at 3 days post injection (3 dpi). No signal was detected in the non-injected fish at 3 days post (3dpf; D). Scale bar represents 500 µm in A and 50 µm in B-D and 1.5 cm in F. Arrow heads in A indicate the areas shown in B-D. n ≥ 5 in A-D and n = 3 in F and G. |
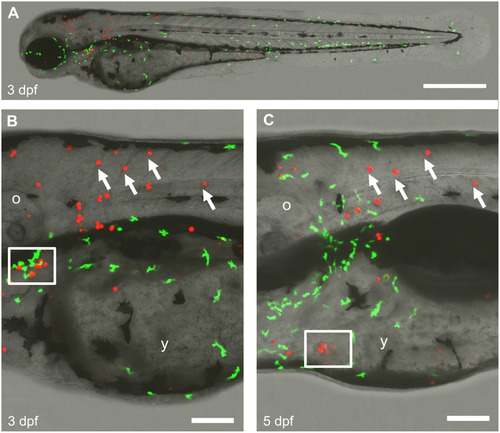
Interaction of algae with the host innate immune system. C. reinhardtii was injected in a BACmpx:GFP transgenic zebrafish embryo and raised until 3 days post fertilization (dpf). Larvae were imaged by confocal microscopy using the green and red channels to visualize the neutrophils (GPF) and algae (autofluorescence) respectively (A). A close up of the same region of the trunk is shown at 3 and 5 dpf (B-C). White arrows in B and C indicate C. reinhardtii persisting cells. The lower white square in B shows a group of cells cell that are not further seen in C, while the white square in C shows the opposite. The scale bar represents 500 µm in A and 100 µm in B-C. o, otic vesicle; y, yolk sack. n ≥ 3. |