
- Title
-
A dual epimorphic and compensatory mode of heart regeneration in zebrafish
- Authors
- Sallin, P., de Preux Charles, A., Duruz, V., Pfefferli, C., Jazwinska, A.
- Source
- Full text @ Dev. Biol.

Determination of the G1/S-phase and the mitotic indexes of cardiac and non-cardiac cells in the zebrafish ventricle. Heart sections were quadruple labeled using DAPI (nuclei) and antibodies against GFP (cmlc2::EGFP, cardiac cells), MCM5 (G1/S-phase) and PH3 (mitosis). (A–C) Uninjured heart contains a few proliferating cells. (B–C) Single PH3-positive mitotic cell (red) within the intact myocardium demarcated by GFP (green). (Có) Higher magnification of the framed area in (C) with an overlap between PH3 (red) and DAPI (blue). (D–I) Heart at 7 dpci displays enhanced cell proliferation in both the post-infarction area and the remaining myocardium. (E, F) PH3-positive mitotic cells (red) at the injury border in the myocardium (green) and in the post-infarcted tissue (GFP-negative, black). (F′,F′′) Higher magnification of the framed areas in (F) with an overlap between PH3 (red) and DAPI (blue). Fragmented pattern of nuclear staining reveals mitotic segregation of condensed chromosomes. (G–I) Representative image of a mitotic cardiac cell. Orthogonal projections demonstrate a co-localization between PH3 (red), GFP (green) and DAPI (blue) staining. Scale bars in (A, B, C)=100 µm; in (G)=10 µm. |

Spatio-temporal distribution of PH3-positive CMs reveals two regenerative patterns in response to myocardial infarction. (A) Representative section of the heart at 7 dpci that was used for mapping PH3-positive cells (red) in the myocardium (green) in respect to the post-infarcted tissue (PIT; encircled by the yellow dotted line). Two zones of the myocardium at a distance of 0-100 and 100-200 µm from the PIT border are indicated with white dotted lines that are labeled with 100 µm and 200 µm, respectively. (A′,A′′) Higher magnifications of the framed area in (A) showing PH3-positive cells at different distances from the PIT border. Scale bar (A, A′′)=100 µm. (B) Plot of the spatial distribution of PH3-positive CMs relative to the PIT border at 7 (n=53 cells) and 17 dpci (n=26 cells). (C) Fractions of PH3-positive CMs in the zones located in the proximity of PIT border (0-200 µm) or at distant locations from the site of injury (200-1300 µm) at 7 and 17 dpci. (D) Fractions of PH3-positive CMs in all the myocardial subdomains at 7 dpci demonstrate a graded distribution in the injury-abutting zone (0-200 µm) and an even distribution in the injury-remote zone (200-1300 µm). |

Spatial distribution of BrdU-labeled CMs after the completion of heart regeneration demonstrates the local and global patterns of the proliferative activity. (A–D) Heart sections of uninjured cmlc2::DsRed2-Nuc transgenic zebrafish treated with BrdU for 21 days (A, B) and at 30 dpci after BrdU treatment from day 7 to day 30 (C, D). The expression of cardiac marker Tropomyosin (TPM blue) and Ds-Red-Nuc reveals nearly complete regeneration of the myocardium at 30 dpci (C, D). CMs after DNA synthesis were identified in both groups by the colocalization of BrdU and dsRed signals (B′, D′, D′′, arrows). (D, D′, D′′) The border between the regenerated myocardium (reg My) and the original myocardium (ori My) can be identified by the difference in the BrdU incorporation (green). The region with abundant BrdU-labeling corresponds to the regenerated myocardium (encircled by a white dotted line). The most adjacent zone at 100 µm from this area is indicated with dashed line. Scale bar (A, Bó)=100 µm. (E) Quantification of BrdU-positive CMs in the entire regenerated heart at 30 dpci and in the uninjured control. (F) Quantification of BrdU-positive CMs in the reg My and in the 100 µm subregions of the ori My compared to uninjured heart. All results are expressed as the mean±standard error of the mean (S.E.M.) (ne5 hearts; 3–5 sections per heart; **** P-value<0.0001). |
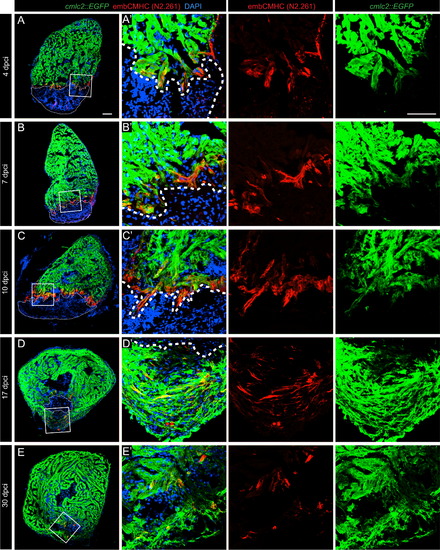
N2.261 immunostaining reveals a reactivation of embCMHC expression at the vicinity of the post-infarcted tissue. (A–E) Representative images of cmlc2::EGFP hearts at different time points during regeneration. Post-infarcted tissue is encircled by a dashed line. (A′–E′) Higher magnifications of the framed areas shown in (A-E). EmbCMHC (red) expression was detected only in the vicinity of the cryoinjury border, where CMs dedifferentiate and reduce cmlc2 expression. At 4 dpci (A), a few scattered embCMHC-positive cells emerge along the injury. At 7 (B) and 10 (C) dpci, the embCMHC-positive cells form a continuous zone above the post-infarcted tissue. At 17 dpci (D), embCMHC-positive cells intermingle with the mature CMs. At 30 dpci (E) only few embCMHC- positive cells are present within the new myocardium. Scale bar (A, A100=(′ µm. |

EmbCMHC-expressing CMs integrate with both the provisional fibrotic tissue and mature myocardium. (A–F) Sections of cmlc2::EGFP hearts at 7 dpci immunostained with antibody against Fibronectin (A,B), Tenascin C (C,D) and Connexin 43 (E,F). The post-infarcted tissue (PIT) is encircled with dashed line. (B′–F′′) Higher magnifications of the framed areas in the left panels. EmbCMHC-positive cells are embedded in the network of the extracellular matrix (ECM) fibers (green) produced by the fibrotic tissue at the myocardial border (B′–D′′). (F′,F′′′) The tight junctions protein, Connexin 43, is strongly upregulated in the juxtaposed mature (embCMHC-negative) and undifferentiated (embCMHC-positive) CMs, indicating the electrical coupling between both types of myocytes. Scale bar (A, B′, B′′)=50 µm. |

Undifferentiated CMs display a higher proliferation rate than the mature CMs of the regenerating myocardium. (A–D) Representative images of cmlc2::EGFP hearts at 7 (A, B) and 17 (C, D) dpci. Post-infarcted tissue (PIT), undifferentiated myocardium (undiff. MyoC, embCMHC-positive, red) and mature myocardium (mature MyoC, embCMHC-negative) are encircled with a dashed line. Proliferating MCM5-positive cells were normalized to DAPI in each of the compartments. (B′) Higher magnification of the framed image in (B). A large accumulation of proliferating cells was observed in the undifferentiated myocardium compartment in comparison to the mature myocardium at 7 dpci. Scale bar (B, B100=′ µm. (E, F) Quantification of MCM5-positive cells reveals a significant increase in the proportion of proliferating cells in the undifferentiated myocardium as compared to mature myocardium at 7 dpci. At 17 dpci, the number of MCM5-positive cells is similar in both myocardial compartments. All results are expressed as the mean±standard error of the mean (S.E.M.) (n≥3 hearts, **** P-value<0.0001). |

Mitotic CMs display upregulation of γ-tubulin. (A-B) Representative image of a heart from cmlc2::EGFP transgenic fish at 14 dpci. Post-infarct tissue is encircled with a dashed line. (B′) Mitotic CMs were detected by the PH3 immunostaining (red). PH3-positive CMs enhance the expression of γ-tubulin (green), which is a component of the mitotic spindle apparatus. (C) Orthogonal projections of a mitotic CM demonstrate a polarized distribution of γ-tubulin around the PH3-positive chromosomes. Scale bar (A, B′, C) = 50 µm.The low level of γ-tubulin in centrosomes of non-mitotic cells is not visible with these image acquisition settings because the levels were optimized according to the fluorescence intensity of PH3-positive cells. |
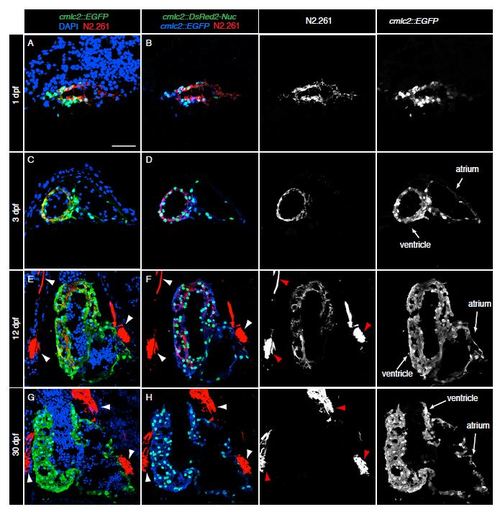
N2.261 antibody reacts with the embryo-specific cardiac myosin heavy chain isoform (embCMHC). (A-H) Heart sections of double transgenic fish cmlc2::EGFP; cmlc2::ds-Red-Nuc at 1, 3, 12 and 30 days post fertilization (dpf). Before the immunostaining, the endogenous signal was quenched by 1M HCL treatment for 30 min followed by antibody staining against GFP, DsRed and N2.261.At 1 dpf (A-B), N2.261 detects all CMs of the primordial heart. At 3 dpf (C-D), N2.261 labels the embryonic ventricle, but not atrium. At 12 dpf (E-F), the N2.261 reactivity is confined to a subset of CMs located in the middle of the ventricle. No expression is detected at the outer cell layer of the ventricular wall. At 30 dpf (G-H), the antigen of N2.261 is not longer expressed in the juvenile heart. Some of skeletal muscles adjacent to the heart are strongly labeled by N2.261 (arrowheads in E-H). Scale bar (A) = 50 µm. |

EmbCMHC expression is reactivated in a cluster of undifferentiated CMs at the vicinity of the ventricular resection plane (A) Representative picture of a wild type heart at 7 days post ventricular resection (dpa) labelled with DAPI (blue), Mef2c (red) and embCMHC (green). Dashed lines indicate the amputation plane. (B-B′) Higher magnification of the framed area shown in (A). EmbCMHC is expressed at the proximity of the amputation plane, where CMs dedifferentiate. Scale bar (A, B) = 100 µm |
Reprinted from Developmental Biology, 399(1), Sallin, P., de Preux Charles, A., Duruz, V., Pfefferli, C., Jazwinska, A., A dual epimorphic and compensatory mode of heart regeneration in zebrafish, 27-40, Copyright (2015) with permission from Elsevier. Full text @ Dev. Biol.