
- Title
-
Selective Responses to Tonic Descending Commands by Temporal Summation in a Spinal Motor Pool
- Authors
- Wang, W.C., McLean, D.L.
- Source
- Full text @ Neuron

Differences in the Dorso-Ventral Distribution of Spinal Axon Collaterals among the Identified nMLF Neurons (A) A schematic of a larval zebrafish viewed from above (A1). The brain area is expanded in (A2) to show the retrogradely labeled descending neurons in the midbrain and hindbrain. The red box highlights the nMLF. In (A3), the three large, identified nMLF neurons are marked. Mid, midline. Scale bar, 20 µm. (B and C) Top-down view of the retrogradely labeled nMLF (white), with two identified nMLF neurons labeled with different colored dyes in the same fish (red and green). (D) A schematic of a larval zebrafish viewed from the side (D1). Lateral view of the reconstructed main axon and collaterals of a MeM (D2), MeLc (D3), and MeLr (D4) neuron in the spinal cord from the region indicated in red on the schematic. (E and F) Lateral view of the spinal cord with the main axon and collaterals of two identified nMLF neurons labeled with different colored dyes in the same fish. Cells are the same as those presented in (B) and (C). White tick marks divide the dorso-ventral extent of spinal cord into ten equal divisions. (G) Total collateral length from body segments 5–14 at each dorso-ventral division for the MeLr and MeM neurons shown in (B) and (E), normalized to the top (1) and bottom (0) edges of spinal cord. (H) As in (G), but for the MeLr and MeLc neurons shown in (C) and (F). (I) Contribution of MeM, MeLc, and MeLr neurons to the total amount of their spinal collaterals expressed as a percentage. Analysis was restricted to the dorso-ventral divisions 0.2–0.7, where spinal motoneurons are located (n = 5 for each cell type). The MeM neuron contributes more to the total collateral length at division 0.2 (black arrowhead), due to its ventral commissural collaterals. |
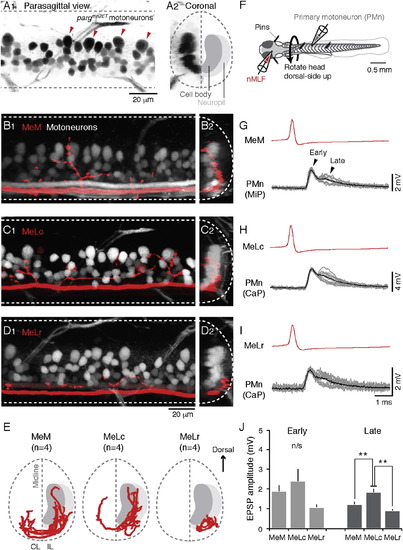
Identified nMLF Neurons Connect to Spinal Motoneurons (A) Images of the spinal cord of a pargmn2Et zebrafish larva, in which GFP is expressed in spinal motoneurons, from the side (A1) and in cross-section (A2). In (A1), the four large, dorsally located primary motoneurons (PMns) in one body segment are marked by red arrowheads. In (A2), the schematic on the right half demarcates the locations of motoneuron cell bodies and neuropil. Dashed lines indicate the boundary of spinal cord and midline. (B–D) Confocal Z stacks of spinal axon collaterals of nMLF neurons (in red) and axial motoneurons (in white) in pargmn2Et zebrafish larvae. Images are from the side ([B1]–[D1]) and in cross section ([B2]–[D2]). The depth of the Z stacks is <20 µm in (B1)–(D1). The cross-sectional images in (B2)–(D2) represent a collapsed view from one body segment (<80–90 µm). (E) Coronal view of reconstructed axon collaterals from MeM, MeLc, and MeLr neurons registered to anatomical landmarks (n = 4 for each cell type), with the cell body and neuropil layers marked as in (A2). IL, ipsilateral; CL, contralateral. (F) Schematic showing the preparation for paired whole-cell patch-clamp recordings from nMLF neurons and spinal motoneurons. (G–I) Example traces from paired recordings from the MeM (G), MeLc (H), and MeLr (I) and a PMn. Individual evoked EPSPs from each pair (gray lines, n = 10 per pair) and an averaged waveform (black line) are temporally aligned to the peak of nMLF action potentials (red, averaged waveform). (J) Peak amplitude of the early and later components of evoked EPSPs in the PMns. Double asterisks indicate significance (Mann-Whitney U test with Bonferroni corrections for multiple comparisons, p < 0.05). n/s, not significant. Here and elsewhere, data are reported as mean ±SEM. |