
- Title
-
Synchronous and asynchronous modes of synaptic transmission utilize different calcium sources
- Authors
- Wen, H., Hubbard, J.M., Rakela, B., Linhoff, M.W., Mandel, G., and Brehm, P.
- Source
- Full text @ Elife
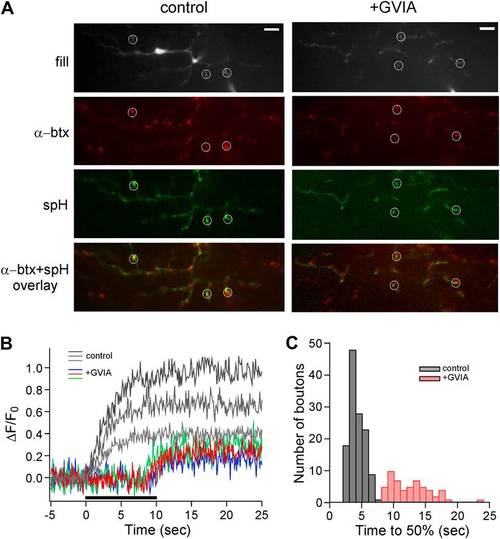
Delayed release in ω-conotoxin GVIA-treated fish is also observed by means of the exocytotic indicator synaptopHluorin. (A) Images taken from a single focal plane of the CaP motor neuron terminals showing the motor neuron fill with Alexa Fluor 647 (gray), postsynaptic labeling with α-btx (red), peak stimulus-induced synaptopHluorin fluorescence (green) and α-btx/synaptopHluorin overlay. These images are shown for a single control (left) and ω-conotoxin GVIA-treated (right) fish. The scale bar corresponds to 10 µm. (B) Stimulus-driven fluorescence change, expressed as ΔF/F0 for the three representative boutons shown for control (gray) and ω-conotoxin GVIA treated (colored) synaptopHluorin motor neurons. The synaptopHluorin signal was measured at each ROI during the time course of 100 Hz stimulation (indicated by the black bar in B). (C) The histogram showing time required to reach 50% maximal fluorescence increase for boutons of control (gray, 127 boutons from 8 fish) and ω-conotoxin GVIA-treated fish (red, 55 boutons from 4 fish). Experiments were performed with 5 mM EGTA in the intracellular solution. |
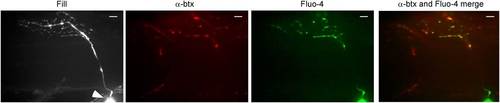
Stimulus-driven calcium signals in CaP motor neuron terminals occurred at synaptic boutons. The fill corresponds to a maximal intensity projection image of the motor neuron filled with Alexa Fluor 647. An arrowhead indicates the soma. A single plane of focus in the filled neuron showing postsynaptic α-btx label, peak Fluo-4 calcium signal and merged α-btx and Fluo-4 signal. The scale bar corresponds to 10 µm. |
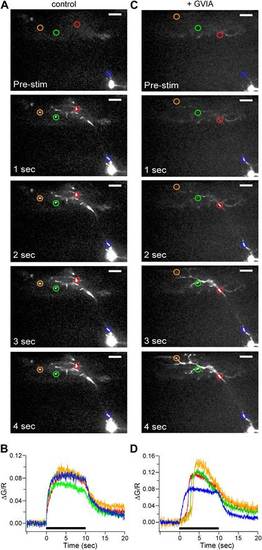
Calcium signal onset is delayed at boutons in ω-conotoxin GVIA-treated fish. (A and C) Sample images of 100 Hz stimulus evoked Fluo-5F fluorescence increases taken at 1 s intervals for 4 ROIs for control (A) and ω-conotoxin GVIA-treated (C) fish. The scale bar corresponds to 20 µm. (B and D) The stimulus-driven fluorescence increases associated with each color-coded ROI in control (B) and ω-conotoxin GVIA-treated (D) fish. The fluorescence was baseline subtracted and the increase was expressed as ΔG/R. Black bars in (B) and (D) indicate the timing of 100 Hz stimulation. Experiments were performed with 0.5 mM EGTA in the intracellular solution. The entire videos for A and C are available as Video 1 and Video 2 respectively. For each video the timing of stimulation is indicated by the dot. |
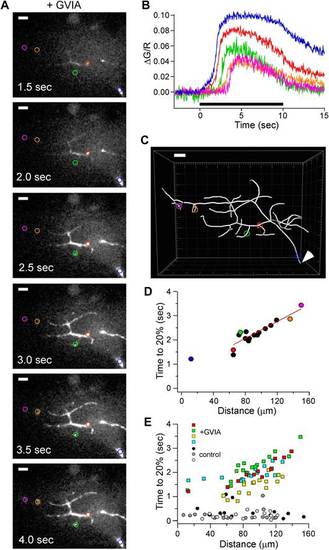
Distance-dependent delay in Ca2+ rise in ω-conotoxin GVIA-treated CaP boutons. (A) Sample images of Fluo-5F fluorescence taken at 0.5 s intervals during 100 Hz stimulation. 5 ROIs are shown at different distances from the reference point at the ventral edge of the notochord. (B) The time course of fluorescence change, expressed as ΔG/R, for each of the ROIs shown in A. The black bar indicates the duration of stimulation. (C) Imaris Filament Tracer 3D reconstruction of the same motor neuron based on z-stacks of the Alexa Fluor 647 fill, with the ROIs in A and B overlaid. An arrowhead indicates the reference point for distance measurements. Scale bars in A and C correspond to 10 µm. (D) The time required for each ROI to reach 20% of peak as a function of the distance from the reference point. The distance measurements for each ROI were determined on the basis of Imaris 3D reconstruction. Colored symbols correspond to the individually colored ROIs shown in the A–C. The data points from the boutons, excluding the first distance measurement, were fit by a line with a slope corresponding to 57 µm/s. (E) Scatter plot of distance-dependent Ca2+ rise for 61 ROIs in ω-conotoxin GVIA-treated neurons (n = 4 fish, colored markers) and 47 ROIs in control (n = 3 fish, gray markers). Each neuron was reconstructed using Imaris filament software to obtain the physical distances. Example cell in A–D is shown with green markers. Measurement was obtained with Fluo-5F and 0.5 mM EGTA in the intracellular solution. |

Simultaneous paired recordings and calcium imaging in ω-conotoxin GVIA-treated fish. The examples shown compare the effects of 0.5 mM (A-D) vs 5 mM (E-H) intracellular EGTA. (A) and (E) Image of the CaP dye filled with Alexa Fluor 647 (green) and target muscle filled with Alexa Fluor 555 (red). Multiple synaptic boutons contacting the target muscle cell are visible as yellow varicosities (scale bar = 10 µm). An enlarged view of the fill (A1 and E1) and peak Fluo-5F calcium response (A2 and E2) are shown for the color coded boutons. (B) and (F) The associated ΔG/R plots for each of the boutons in A and E as a function of time during 20 s, 100 Hz stimulus (indicated by black bar), which began at time 0. (C) and (G) The associated patch clamp recording showing the motor neuron action potential (top) and postsynaptic EPCs (bottom) during the 20 s, 100 Hz stimulation. The scale bars correspond to 40 mV, 1 nA, and 2 s. (D) and (H) An overlay plot showing the coincidence between the onset of the mean ΔG/R fluorescence for all ROIs (blue with gray SD) and the onset of asynchronous release (red). Release was shown as integrated synaptic charge entry for each consecutive half-second of stimulation. |

Depolarization-induced regenerative calcium wave in the presence of TTX. (A) Peak response of the Fluo-4 calcium signal following depolarization from 80 mV to +50 mV for 2 min in the presence of 1 µM TTX. The color coded ROIs are indicated. (B) Measurements of ΔG/R from the ROIs indicated in (A) show that calcium propagation traveled in two successive, distinct movements into the boutons. Each data point represents the flattened stack of 15 sections, each 1 µm thick, acquired with 1 s intervals between stacks. Experiment was performed with 0.5 mM EGTA in the intracellular solution. (C) Time to reach 50% of the first peak was plotted against distance from the soma for the example. ROIs shown in A and B are indicated with colors and additional ROIs not shown are black. The data points were fit to a line. The video for this recording and a second example recording are available as Video 3 and Video 4 respectively. |