
- Title
-
Modelling Delta-Notch perturbations during zebrafish somitogenesis
- Authors
- Murray, P.J., Maini, P.K., and Baker, R.E.
- Source
- Full text @ Dev. Biol.
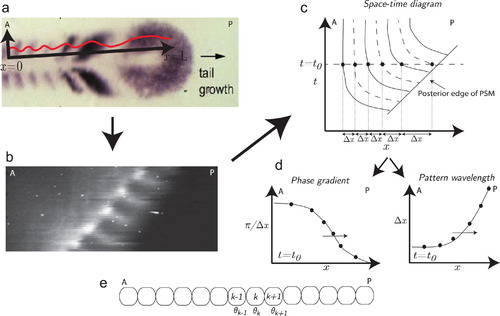
(a) A zebrafish DeltaC in situ expression profile (Giudicelli et al., 2007) with a superimposed schematic of intensity peaks. (b) Real-time mouse clock expression patterns illustrated in a space–time diagram (Masamizu et al., 2006). Levels of gene expression (greyscale) are plotted against axial position and time. Copyright (2006) National Academy of Sciences, USA. (c) A schematic illustration of the fluorescence intensity plot presented in (b). The dashed line at t=t0 represents a snapshot in time and the peaks and troughs are comparable to those depicted in (a). The markers, separated by spatial lengths Δx, along the dashed line represent increases in π in the phase of the pattern (i.e. peak to trough). (d) Using the space–time plot in (c), the phase gradient and pattern wavelength at t=t0 can be approximated by π/Δx and Δx, respectively. The arrow represents the posterior propagation of the profiles. (e) A schematic illustration of a one-dimensional chain of phase coupled oscillators aligned along the AP axis. Anterior (A) and posterior (P). |
Reprinted from Developmental Biology, 373(2), Murray, P.J., Maini, P.K., and Baker, R.E., Modelling Delta-Notch perturbations during zebrafish somitogenesis, 407-421, Copyright (2013) with permission from Elsevier. Full text @ Dev. Biol.