
- Title
-
Pan-epicardial lineage tracing reveals that epicardium derived cells give rise to myofibroblasts and perivascular cells during zebrafish heart regeneration
- Authors
- Manuel González-Rosa, J., Peralta, M., and Mercader, N.
- Source
- Full text @ Dev. Biol.

Epicardial derived cells migrate upon cryoinjury. (A-D) Whole-mount imaging of dissected control and cryoinjured hearts (12 h postinjury: hpi) from the ET27 and Tg(wt1b:eGFP) lines. Nuclei are counterstained with DAPI (blue). A′-D′ are zoomed images showing the GFP channel in the boxed areas in A-D. Arrows marks GFP+ cells, arrowheads mark morphological cell features. (E-J) Comparison of the expression domains of wt1b:GFP protein and gfp and wt1b mRNA. (E,E′) Full view and zoomed images of gfp in situ hybridization on a Tg(wt1b:eGFP) heart section at 7 dpi. Yellow arrows mark cells expressing gfp mRNA, black arrows mark cells devoid of gfp mRNA expression. (F,F′) Same sections in E,E′ after anti-GFP immunohistochemistry. Yellow arrows mark cells coexpressing GFP protein and gfp mRNA, black arrows mark cells only expressing GFP protein. (G) and (H) Percentage of cells coexpressing gfp mRNA and protein (G) or only protein (H). Note that while most epicardial cells coexpress gfp mRNA and protein, most subepicardial cells only express GFP protein. (I) and (J) Percentage of cells coexpressing wt1b mRNA and GFP protein (I) or only protein (J). Results are similar to those in G and H. Data are means of cell percentages±S.D. counted on 1-3 heart sections per specimen from 2-5 specimens (***P<0.001; **P<0.01; one-way ANOVA followed by Tukey′s honest significant difference test; 100-150 cells counted per section). AT, atrium; BA, bulbus arteriosus; cv, coronary vessel; dpi, days postinjury; IA, injured area; ISH, in situ mRNA hybridization; V, ventricle. Bars, 200 μm (full views) and 50 μm (magnifications). |

wt1b:eGFP cells give rise to perivascular cells and express fibroblast marker genes upon cryoinjury. (A) and (B) Immunohistochemistry on sections of cryoinjured Tg(wt1b:eGFP) hearts, using antibodies against myosin heavy chain (red) to detect myocardium and GFP (green) to detect wt1b:eGFP+ cells. A′-B′ are zoomed images of boxed areas in A and B, additionally showing myosin light chain kinase (MLCK, white) to detect smooth muscle cells surrounding coronary endothelial cells. The bottom row shows three separate channels for the zoomed regions. (A′) At 3 dpi, GFP+ cells surround but do not co-localize with MLCK+ cells. Note that not all epicardial cells are GFP+ (white arrows). (B′) At 60 dpi the few GFP+ cells visible in the cryoinjured heart are again associated with coronary vessels. Yellow arrows mark GFP+ cells. (C) and (D) Whole mount fluorescence imaging in control (C-C′) and 12 hpi cryoinjured hearts (D,D′) from the Tg(wt1b:eGFP)/Tg(fli1a:DsRedEx) line. Zoomed views show DAPI nuclear counterstaining. Endothelial cells are visible by DsRed fluorescence. White arrows mark endothelial cells and yellow arrowheads highlight wt1b:GFP+ cells in close apposition. (E-H) Sections of cryoinjured Tg(wt1b:eGFP) hearts (3 dpi) hybridized with riboprobes for periostin and collagen 1 alpha 2 mRNAs. In panels F and H, sections were immunostained for GFP after ISH. Arrows mark GFP+ cells co-labelled with the ISH probe. Abbreviations are as in previous figures. A′-H′ are zoomed views of the boxed areas in E-H. Bars, 200 μm (full views), 50 μm (magnifications). |

Cardiac tissue transplantation method for the study of cellular contribution during zebrafish heart regeneration. (A) Experimental scheme. Donor hearts from a transgenic reporter fish line were cryoinjured and dissected at 3 dpi. Cardiac tissue explants containing epicardium were transplanted into freshly-cryoinjured hearts of irradiated wild type fish. Host hearts were fixed at different stages and the contribution of grafted cells to the regenerated tissue analysed. (B) Quantification of the size of the grafted tissue. The plot shows the size of 26 grafts at 3 days posttransplantation (dpt), each graft being represented by a circle as the percentage relative to the host ventricle. The horizontal bar indicates the mean % of the graft size. (C) Cell composition of grafts. The percentage of cells expressing endothelial/endocardial, myocardial and epicardial markers within each graft was estimated by FACS of cells from 4 to 6 donors before transplantation. Horizontal bars indicate the mean % of cells. (D-E′) Bright field and fluorescence images of hearts at 4 dpt. (D-D′′) Transplantation of a Tg(β-actin:GFP) graft to an uninjured wildtype (WT) heart did not result in contribution of graft-derived cells to the host. (D) Bright field whole mount view. (D′) GFP fluorescence in the specimen in D: while grafted tissue (asterisk) is strongly GFP+, no GFP+ cells are found on the surface of the host heart (the signal in the bulbus arteriosus is autofluorescence). (D′′) Immunohistochemistry on sections, using antibodies to myosin heavy chain (MHC) to label myocardium (red) and GFP to label grafted cells (green) reveals green cells in the graft but not in the host heart. Cell nuclei are labelled with DAPI (blue). (E-E′′) After grafting Tg(β-actin:GFP) tissue to a cryoinjured heart, GFP+ cells attach to and spread over the surface of the host myocardium. Views are as in D-D′′. Immunohistochemistry on sections reveals β-actin:GFP cells inside the host heart. Arrowheads in D′′, E′ and E′′ mark GFP+ cells. (F-G′′) Effect of irradiation on cell proliferation. (F-F′) Immunohistochemistry on wildtype heart sections at 3 dpi, revealing phospho-histone H3 (pH3) staining in green, myosin heavy chain (MHC) in red and nuclear counterstain with DAPI (blue). F′ shows a zoomed view of the boxed area in F, and separate channels of the central area are shown to the right. Arrowheads mark numerous pH3+ cells close to the IA, and the white arrow marks a mitotic cell with punctuated pH3 staining (late G2). (G-G′′) Staining as in F on a cryoinjured heart from an irradiated wildtype fish grafted with tissue from the cryoinjured heart of Tg(cmcl2:GFP) donor fish at 3 dpt. The panels show a whole-mount view (G) and zoomed views of boxed areas (G′ and G′′). While the graft contains numerous pH3+ cells, including cardiomyocytes (G′), the irradiated host heart is almost devoid of pH3+ cells (G′′). pH3-positive cells from the graft are marked by white arrows; that in the irradiated host is marked by a yellow arrow. G′ and G′′ represent zoomed views of boxed regions in G showing merged and single channel views. Note the pH3-positive cardiomyocyte in G′. Asterisks mark the graft. Abbreviations as in previous figures. Bars, 200 μm (full views) and 50 μm (magnifications). |
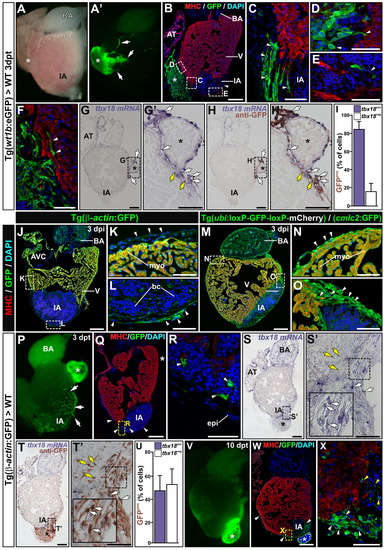
Transplantation assays allow the study of pan-EPDC migration and differentiation during cardiac regeneration. (A,A′) Brightfield and fluorescence images of a freshly-dissected 3 dpt wildtype heart transplanted with a Tg(wt1b:eGFP) graft. Arrows mark GFP+ extensions of the graft migrating over the host. (B) Whole heart cross-section showing the Tg(wt1b:eGFP) graft adhered to the host. (C-F) Zoomed views of boxed areas in B (C-E) or areas from adjacent sections (F), showing the epicardial sheet covering the IA (C), protrusions of wt1b:eGFP+ cells extending towards the host myocardium (D), a migratory wt1b:eGFP+ cell inside the IA (E), and GFP+ cells intermingled with host cardiomyocytes (F). Arrowheads mark GFP+ cells. (G,G′) Whole-mount and zoomed views of an in situ hybridization with a tbx18 riboprobe on a section of a transplanted heart at 3 dpt. (H,H′) Section in G after immunohistochemistry with anti-GFP. (I) Percentage of GFP+/tbx18+ and GFP+/tbx18- cells in the host. Data are means of cell percentages ±S.D. counted on 2-3 heart sections per specimen from 5 specimens (80 cells counted per section). (J-O) Immunohistochemistry on sections of Tg(-actin:GFP) (J-L) and Tg(ubi:loxP-GFP-loxP-mCherry)/(cmlc2:GFP) hearts (M-O). Antibodies/stains used are indicated to the left of the panels. Arrowheads mark epicardial cells. (P-X) Tg(-actin:GFP)>WT transplants at 3 and 10 dpt. Arrowheads mark graft-derived cells. (P) Whole-mount fluorescence view at 3 dpt. Arrows point to grafted cells on the surface of the host heart. (Q) Immnohistochemistry on a sagittal section of the heart shown in P. (R) Zoomed view of boxed area in Q revealing cells that migrated into the IA. (S,S′) Whole-mount and zoomed views of in situ hybridization with tbx18 on a Tg(β-actin:GFP)>WT heart section. (T,T′) Section as in S and S′ after immunostaining for GFP. Note the strong overlap of tbx18 and GFP expression. (U) Percentage of GFP+/tbx18+ and GFP+/tbx18- cells in the host. Data are means of cell percentages ±S.D. counted on 3 heart sections per specimen from 3 specimens (50 cells counted per section). (V) Full view of a freshly dissected heart at 10 dpt. (W) Immunohistochemistry on a sagittal section of the heart shown in V. Antibodies used are specified in the panel. (X) Zoomed view of boxed area in V, revealing cells forming an epicardial cap over the IA. Note that no GFP+/MHC+ cells are detected. In all panels, asterisks mark the graft or its position in a consecutive section. In G-H′ and S-T′ white arrows label GFP+/tbx18+ cells and yellow arrows GFP+/tbx18- cells. AVC, atrioventricular canal, epi, epicardium. Other abbreviations are as in previous figures. Bars, 200 μm (full views) and 50 μm (magnifications). |

Long term follow up of transplants. (A) Scheme of the experimental procedure and possible outcomes of transplantation assays using the Tg(cmlc2:CreERT2)/(ubi:loxP-GFP-loxP-mCherry)/(cmlc2:GFP) line as donor. Recombination was induced at larval stages to induce mCherry expression in cardiomyocytes. Grafts of transgenic fish, expressing mCherry and GFP in the myocardium and GFP only in all other cells, were transplanted onto cryoinjured wildtype hearts. If grafted myocardium contributes to the regenerating myocardium, GFP/DsRed cells will be found in the host heart. If any non-myocardial donor cell contributes to the regenerated host myocardium, GFP+ cardiomyocytes would be found in the host heart. (B-B′′) Freshly dissected heart revealing non-detectable graft at 30 dpt, revealed by the absence of signals for GFP (B′) and mCherry (B′′). Note the presence of a large IA and the absence of regeneration. (C) Immunohistochemistry on a section of the same heart as in B. Antibodies used are indicated in the panel. Note that no GFP+ (graft-derived) cells can be found inside the host heart. (D-D′′) Freshly dissected heart revealing no signs of injury at 30 dpt and a visible graft: the host heart contains graft-derived cells (D′) but no graft-derived cardiomyocytes (D′′). (E) Immunohistochemistry on a section of the same heart as in D. Antibodies used are indicated in the panel. Many GFP+ cells are detected inside the host and accumulate at the borders of the remnant IA (arrows). Note the partial regeneration of the myocardial wall. Arrowheads mark graft, arrows mark graft-derived GFP-positive cells. (F-I′) Immunohistochemistry on sections with antibodies indicated above the panels; panels F′-I′ show zoomed views of boxed areas. There is no collocalization of GFP with the myocardial marker MHC, but broad overlap with MLCK and Col-1α1. Asterisks mark the graft or its position in a consecutive section. Bars, 200 μm (full views) and 50 μm (magnifications). |

|

|

|

|

|

|
Reprinted from Developmental Biology, 370(2), Manuel González-Rosa, J., Peralta, M., and Mercader, N., Pan-epicardial lineage tracing reveals that epicardium derived cells give rise to myofibroblasts and perivascular cells during zebrafish heart regeneration, 173-186, Copyright (2012) with permission from Elsevier. Full text @ Dev. Biol.