
- Title
-
Tissue-specific differential induction of duplicated fatty acid-binding protein genes by the peroxisome proliferator, clofibrate, in zebrafish
- Authors
- Venkatachalam, A.B., Lall, S.P., Denovan-Wright, E.M., and Wright, J.M.
- Source
- Full text @ BMC Evol. Biol.
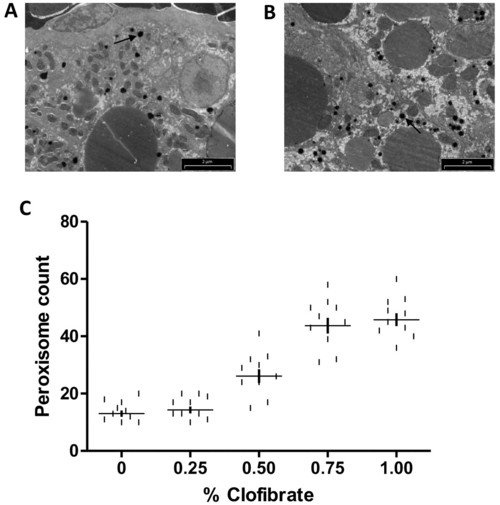
Electron micrographs of hepatocytes of zebrafish after clofibrate treatment. Staining of peroxisomes in the hepatocytes of zebrafish fed 0% clofibrate (A) and 1.00% clofibrate (B). Number of peroxisome per field of view in liver increased with increasing concentration of clofibrate fed zebrafish (C). Arrows point to peroxisomes. Bar = 2 μm. |
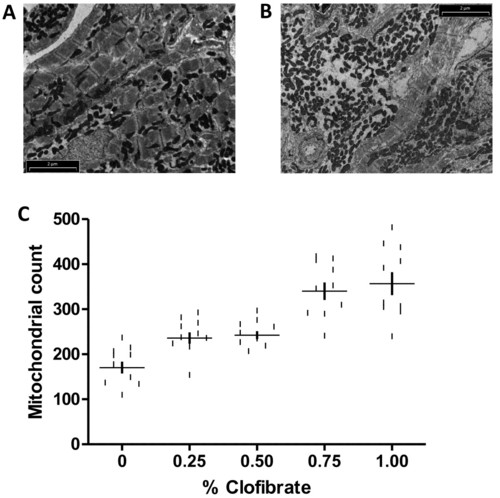
Electron micrographs of heart cells of zebrafish after clofibrate treatment. Mitochondria in the heart cells of zebrafish fed 0% clofibrate (A) and 1.00% clofibrate (B). Number of mitochondria per field of view in heart increased with increasing concentration of clofibrate fed zebrafish (C). Bar = 2 μm. |